PTS XT- Extreme Trend Tool
The *New* PTS-XT Extreme Trend Tools
The *New* PTS Extreme Trend Tool automatically identifies Extreme Trend Momentum Areas regardless of what market or time frame you are trading.
Traders who only trade in the “Extreme Zone” have shown to have had consistent results set-ups in normal market environments

$4995 $4,495 (Save $500) and New Customers get 12 months on PTS Primo Charts
The PTS XT- Extreme Trend Tool…
- Trading in these zones will increase your odds for consistency
- Trading ONLY in these zones will keep you out of choppy/whipsaw markets
- These zones pinpoint the “low hanging fruit” areas for trading
- The PTS-XT allows you to trade any method or strategy that is in sync with them
- Can be applied as a market timing tool that tells you when to be in or out of the markets of of a particular sector
- Eliminate trading traffic jams and congestion-When the market is in a range or whipsaw environment it’s the same as a traffic jam or congestion. This is where most traders lose money. The PST-XT usually won’t color the bars under those conditions so as an added advantage you can also stay away from those trading areas as well.
- See right on your chart when in the PTS XT Extreme Trend Zones for better buying and selling decisions.
- Also comes with the PTS XT Scanner to pull up current setups
- Works in all markets
- Works in all Time Frames
Also Included with the PTS XT Extreme
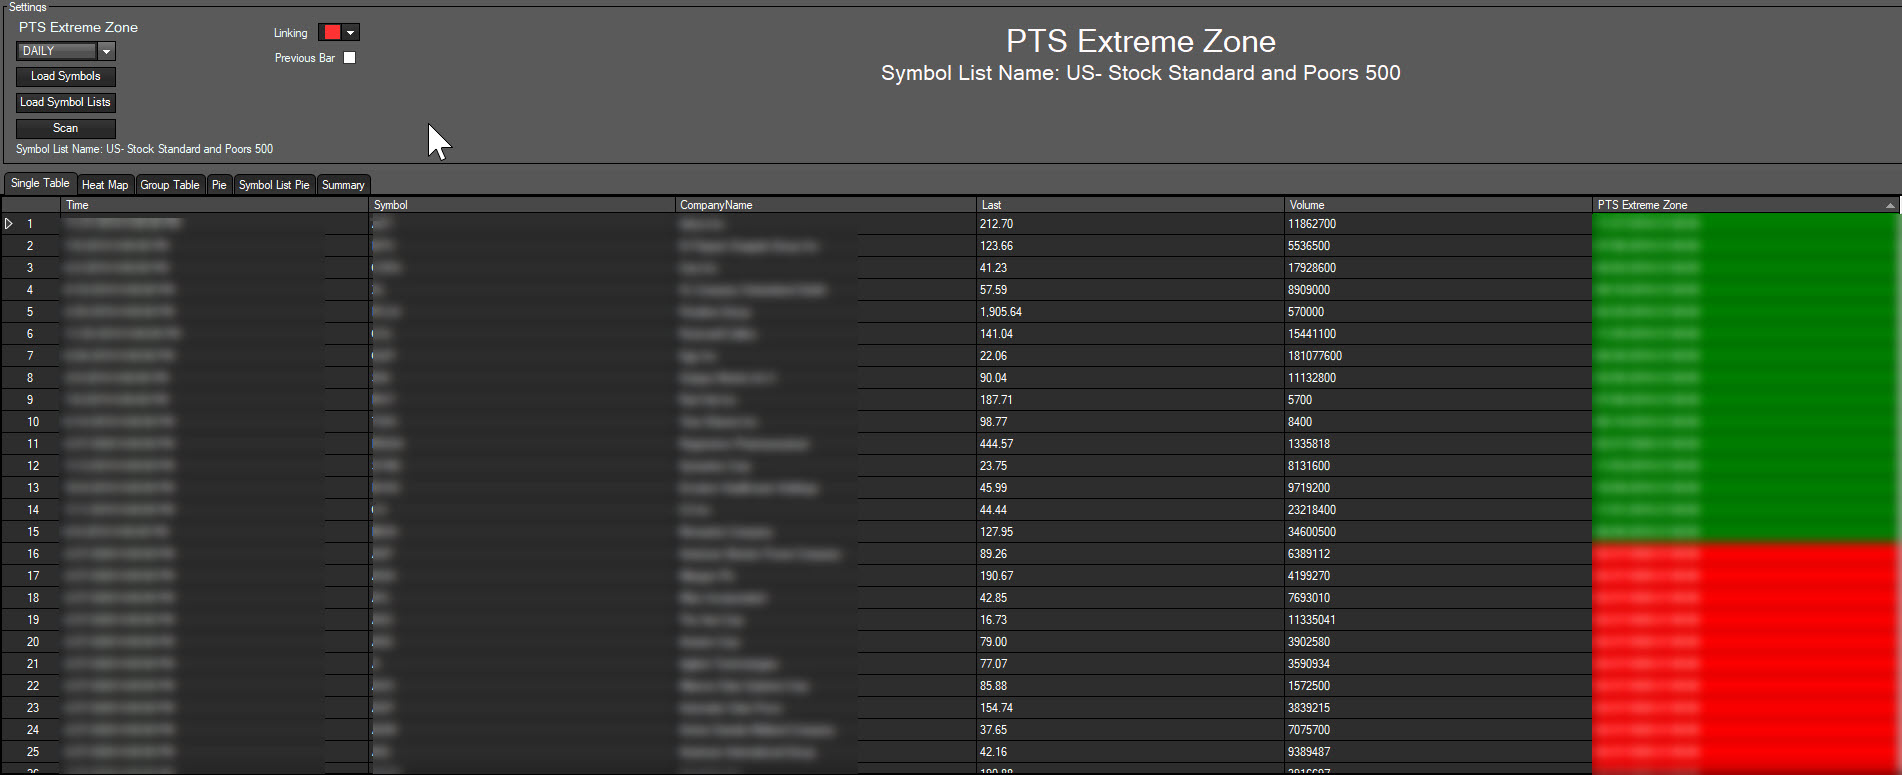
PTS XT Extreme Scanner
Scan for the latest Bullish and Bearish PTS Extreme XT Setups
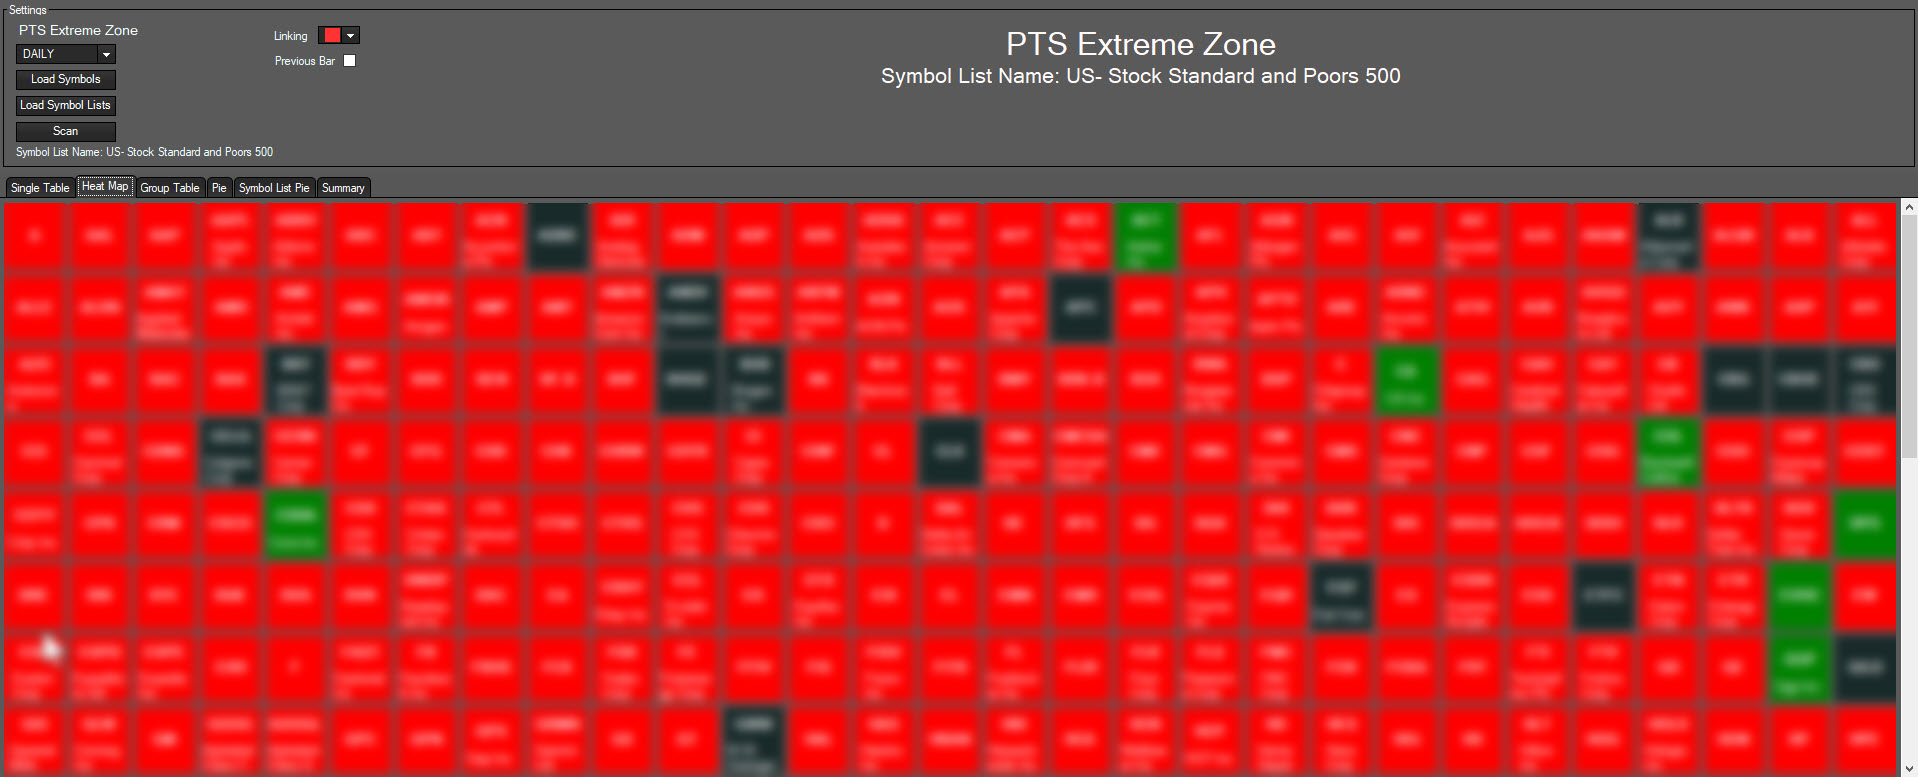
PTS XT Extreme Heat Maps
Get a better look by switching to the PTS XT Extreme Heat Maps
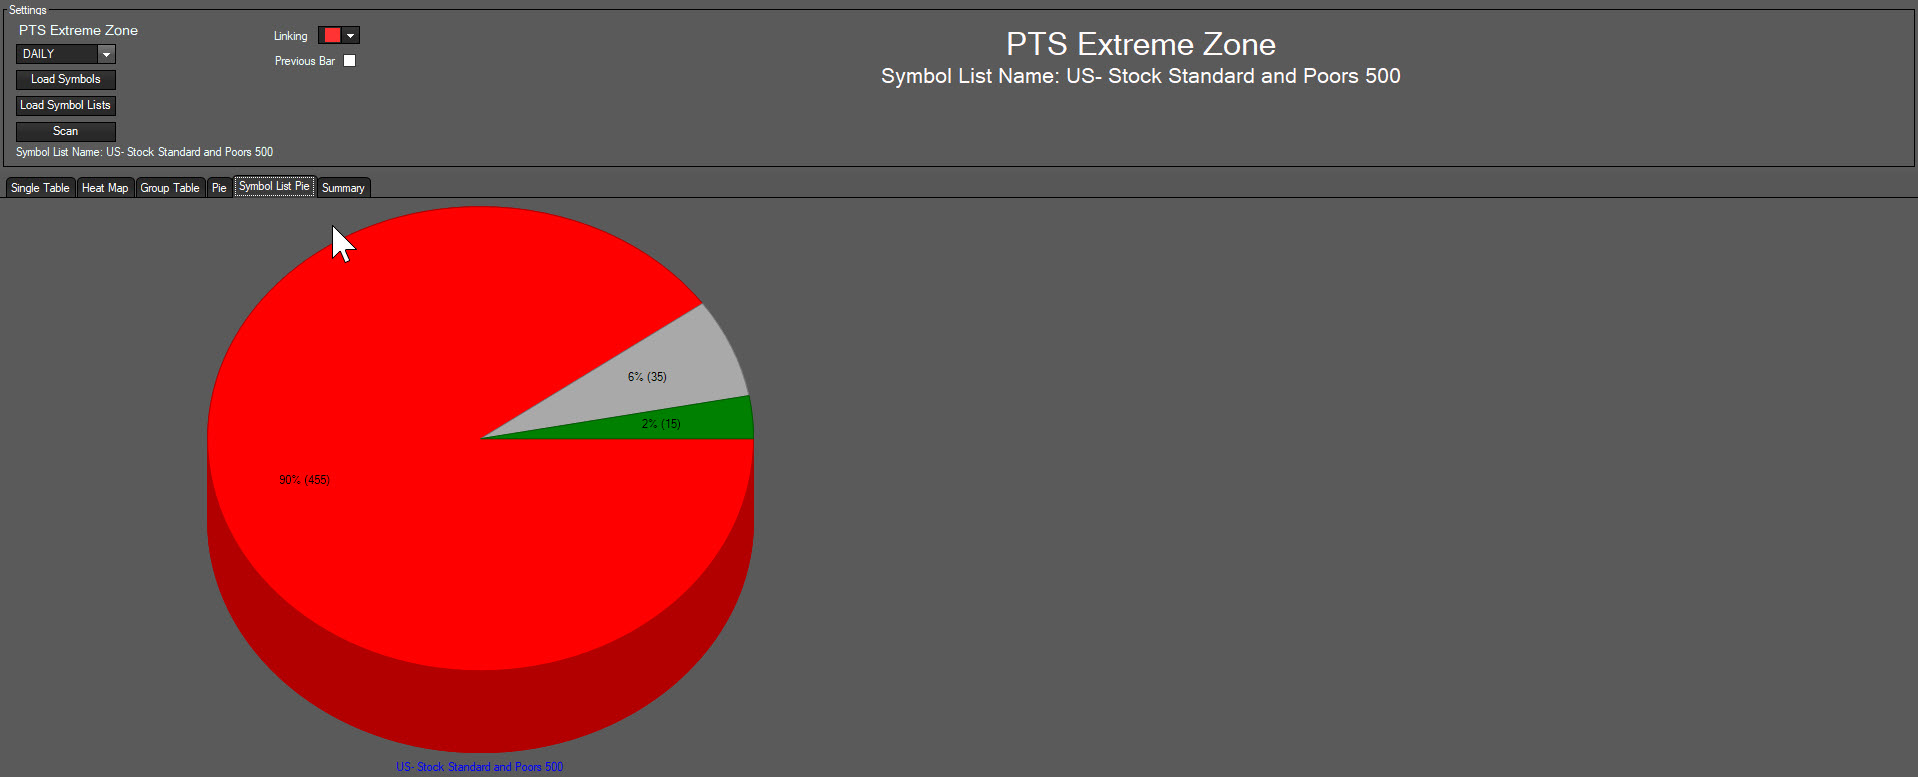
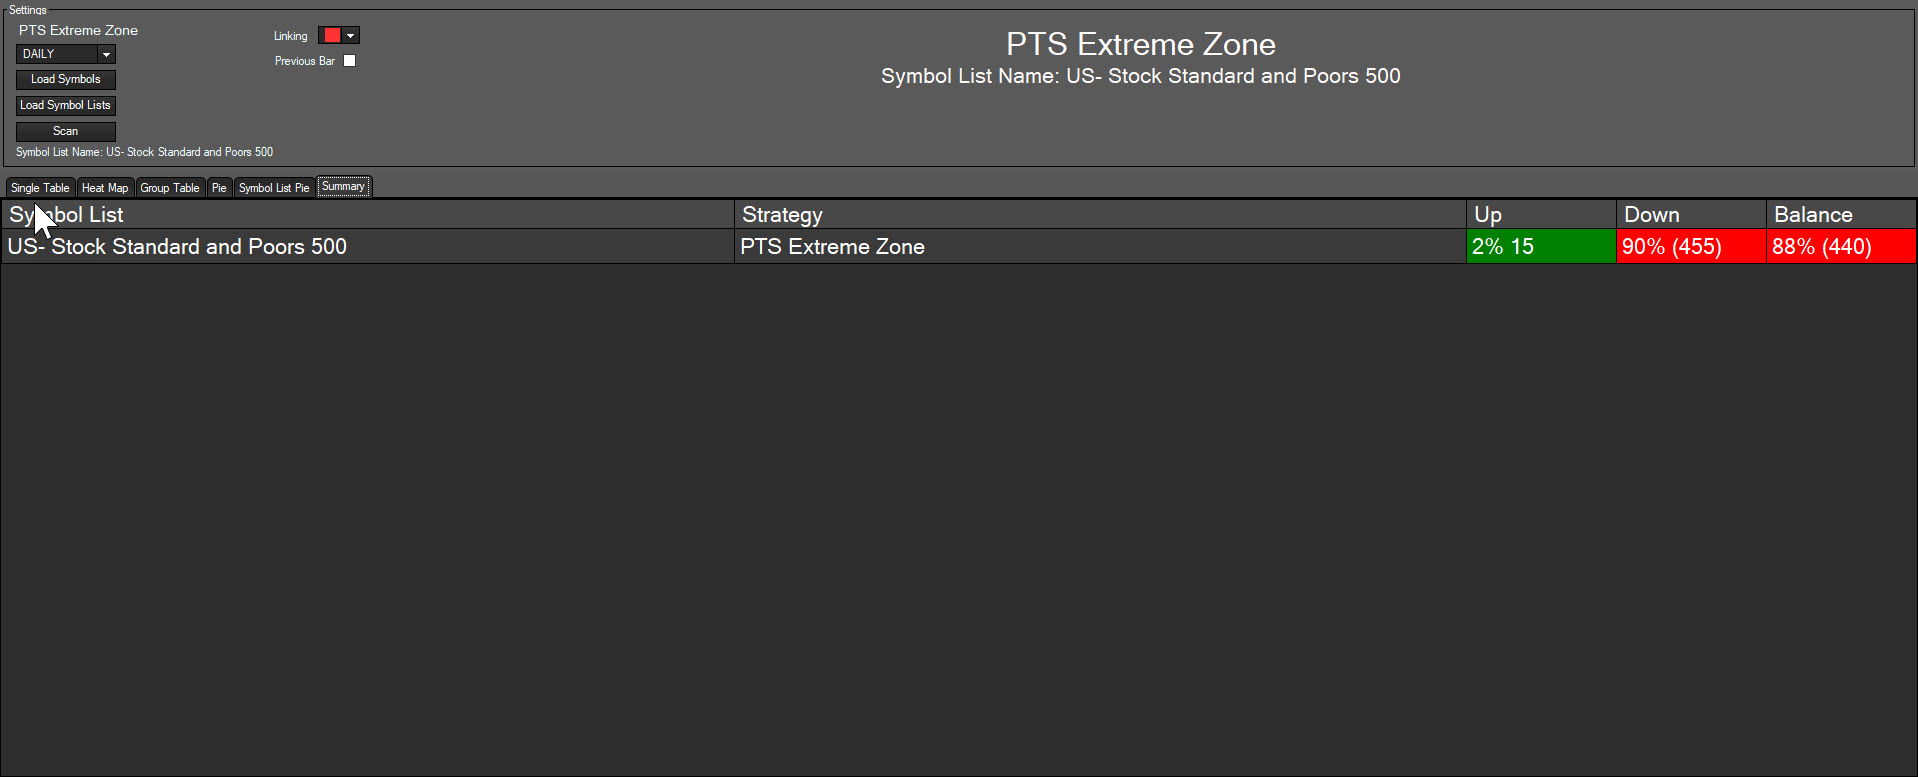
PTS XT Extreme PIE and % View
See what the % breakdown is of PTS XT Extreme Results.
View Overall Results for Bullish, Bearish and No Signals
PTS XT-Extreme Trend Chart Indicator (Blurred)
See the PTS XT-Extreme Trend right on your chart
PTS-XT: The only job of the PTS-XT indicator is to identify “Extreme Trends” in advance. It does this by displaying a “color-block” (Yellow for uptrend/ Red for downtrend) around bars that it technically determines to be in an extreme move. Many students have reported increased levels of consistency by only trading in the colored blocks, regardless of what strategy or technique is applied. The PTS-XT is a proprietary tool (formula is kept in house) that can be applied to any market, any time frame, and any direction. Because of it’s simplicity in use, the PTS-XT is now our most popular tool among students.
Questions 310 598-6677 or [email protected]
