
The Top 100 Breakouts of All Time
From the 1924 Dow to 2025 silver: the 100 greatest breakouts in market history, counted down from #100 to a #1 we keep secret until you’re inside. Every one comes with a narrated video telling the story behind the move, an annotated chart, a full lesson and a checklist to spot the next one.

Eight of the hundred stories inside
Every breakout has a back story: a product, a panic, a policy shift or a shortage. The course tells each one, then shows you exactly where the base, the breakout and the run happened on the chart.
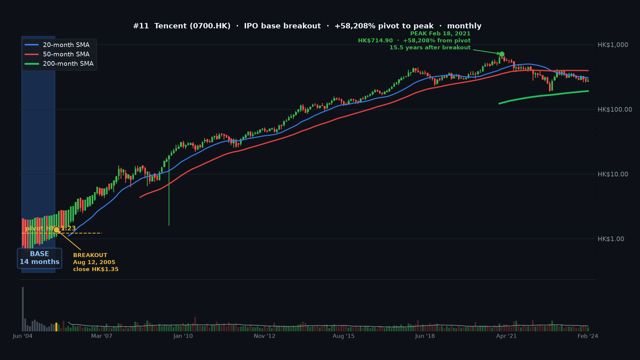
Tencent
China’s messaging leader clears its first base after listing in Hong Kong, then compounds for 15 years.
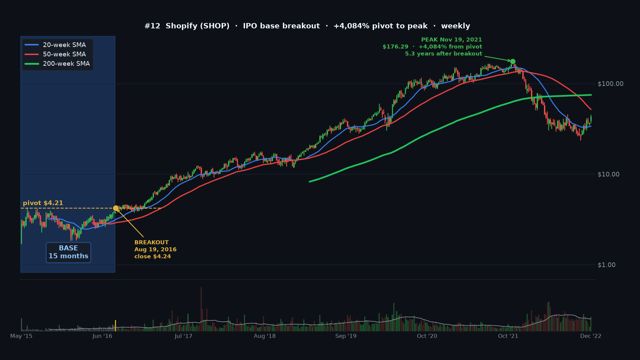
Shopify
A 14-month post-IPO base gives way as merchant growth speeds up, starting a five-year run.

Walmart
A five-year base after the 1973-74 bear market, then a decade of small-town store rollouts.
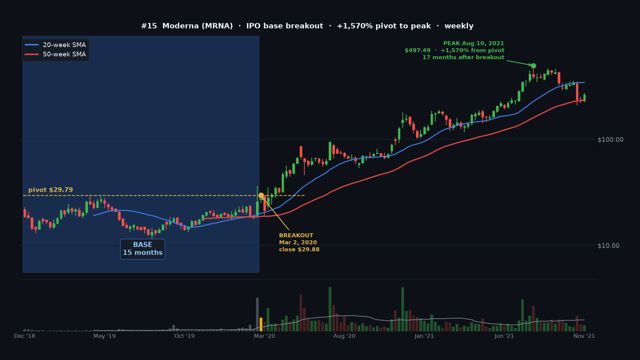
Moderna
A young biotech clears its IPO base in the middle of the Covid crash as its vaccine program races ahead.
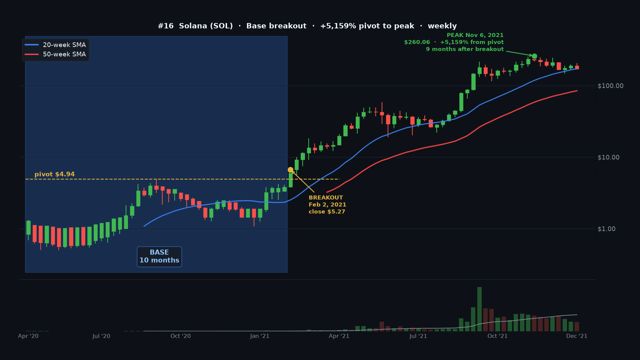
Solana
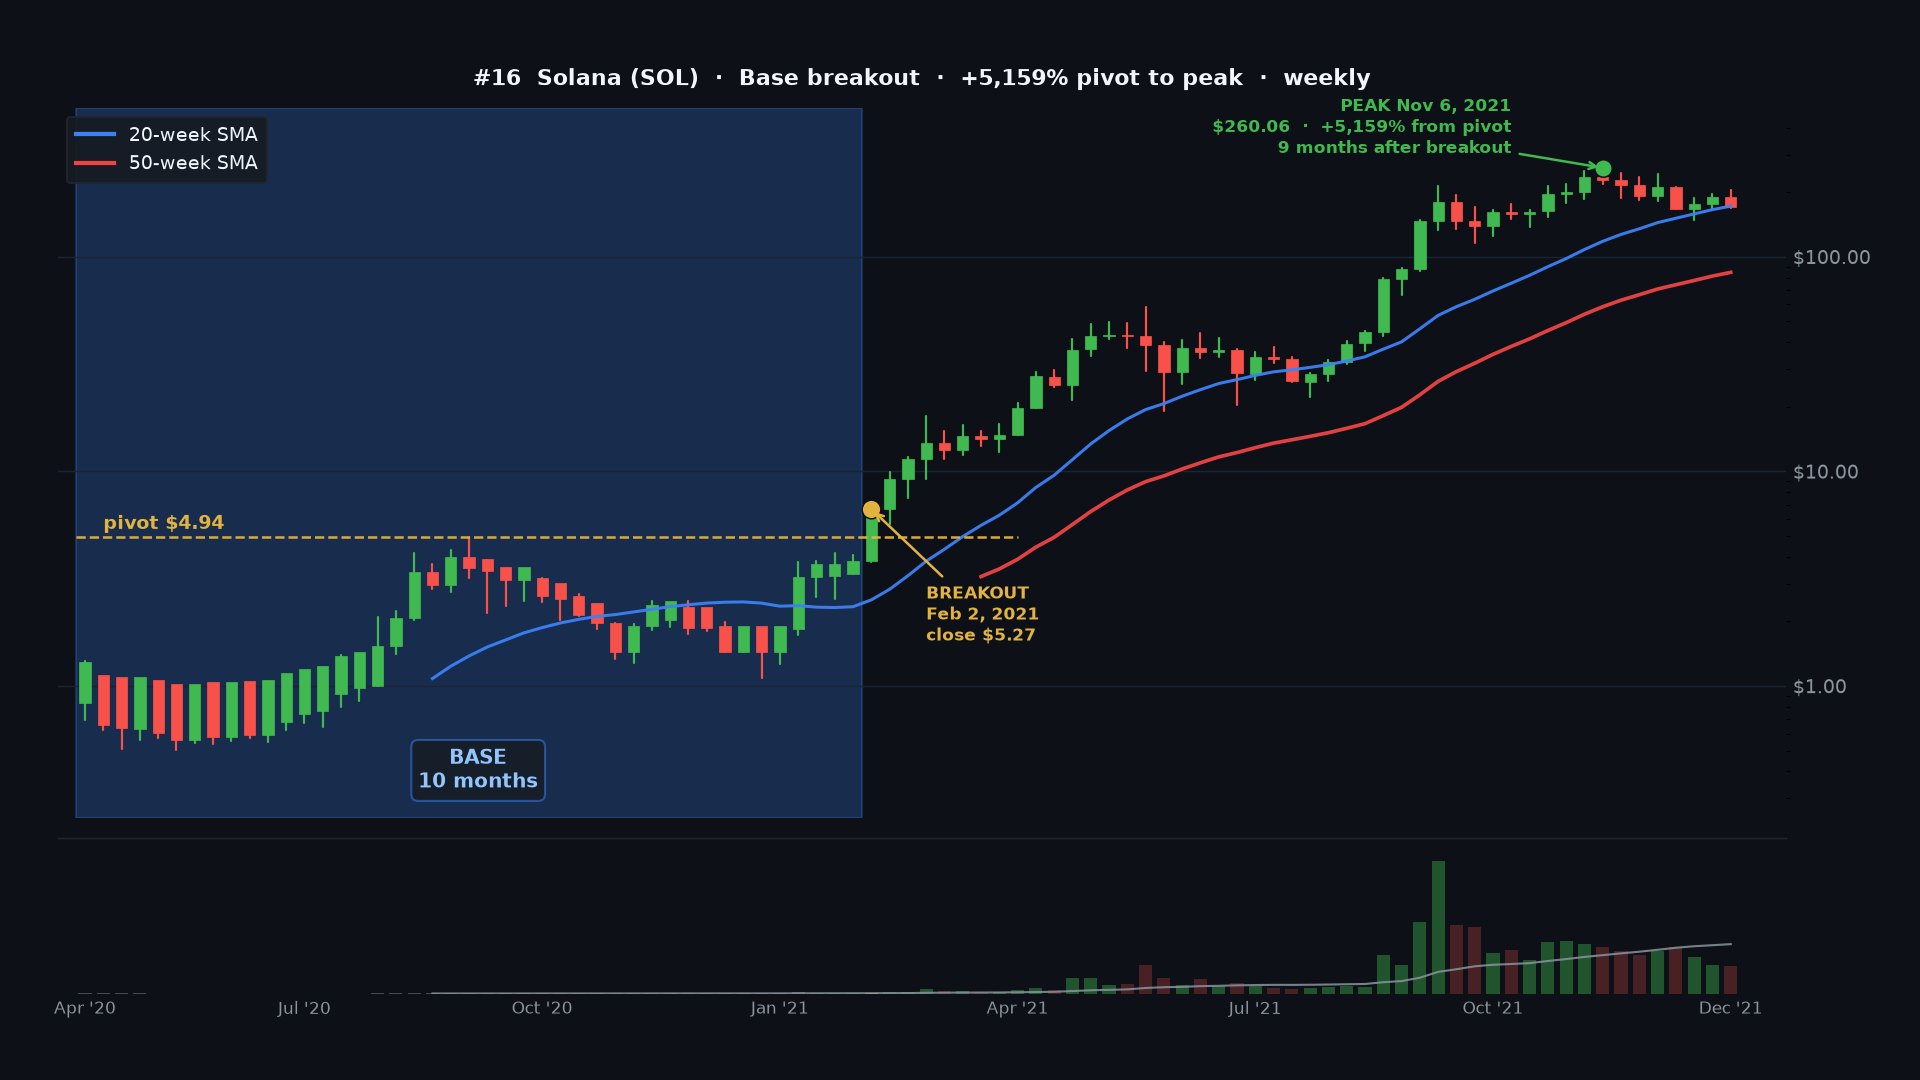
A new, faster blockchain breaks out of its 2020 base and rises more than 50-fold in nine months.
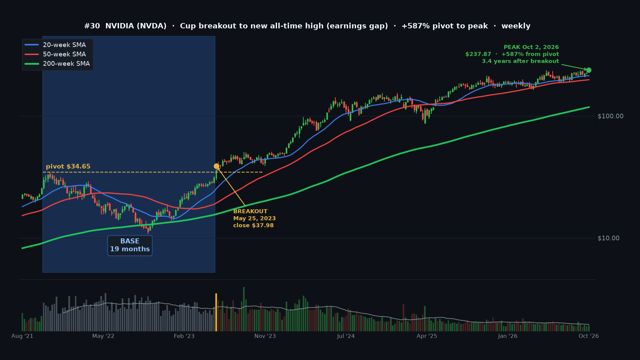
NVIDIA
An AI-driven sales forecast gaps NVIDIA out of a cup to new all-time highs.
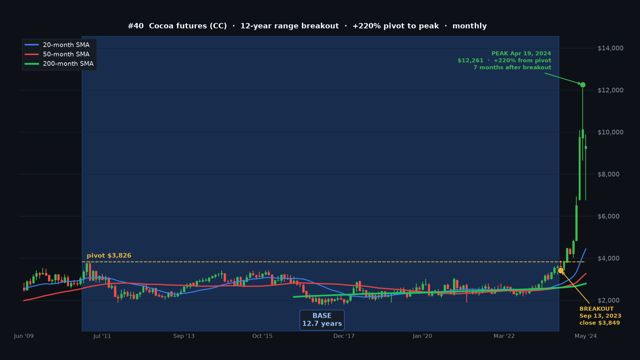
Cocoa futures
Failed West African crops push cocoa out of a 12-year range and more than triple it.
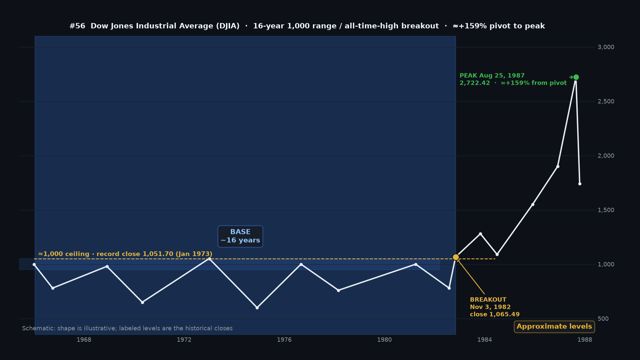
Dow Jones Industrial Average
After 16 years of failing near 1,000, the Dow closes at a record and a secular bull market begins.
Watch real lessons from the course
Each video runs about one to two minutes: the back story, then the base, the breakout, the run and the lesson. Press play.
What every lesson gives you
- The back story videoThe company or market, what was going on and the catalyst behind the move.
- The baseHow long it built, how deep it corrected and where the ceiling, the pivot, was.
- The breakoutThe day it closed above the pivot, the volume behind it and where it sat against the Buy/Sell Line.
- The runHow far and how fast it went, the worst pullback along the way and when the trend finally broke.
- Why it worked and your checklistThe real reason behind the move, plus three things to look for next time.
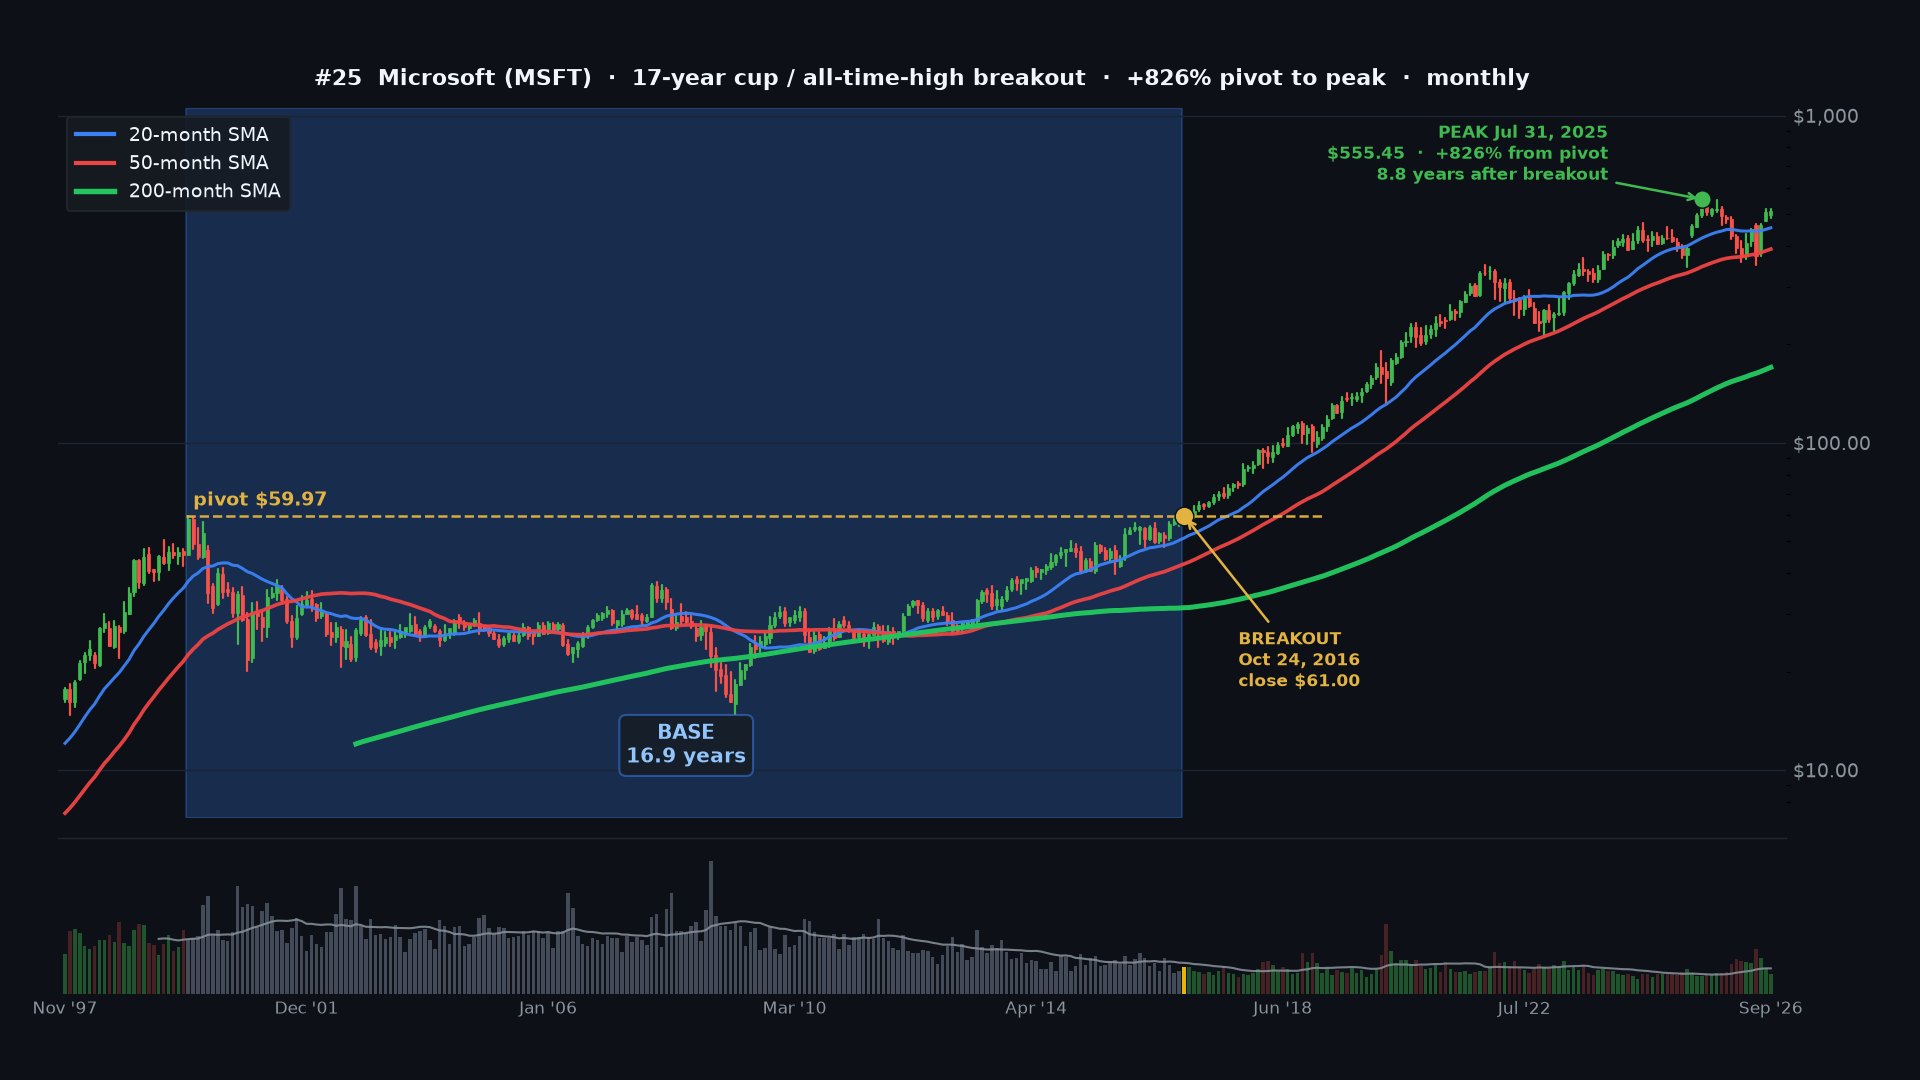
Browse the charts
Twenty of the 100 annotated charts. Click any one to enlarge it.
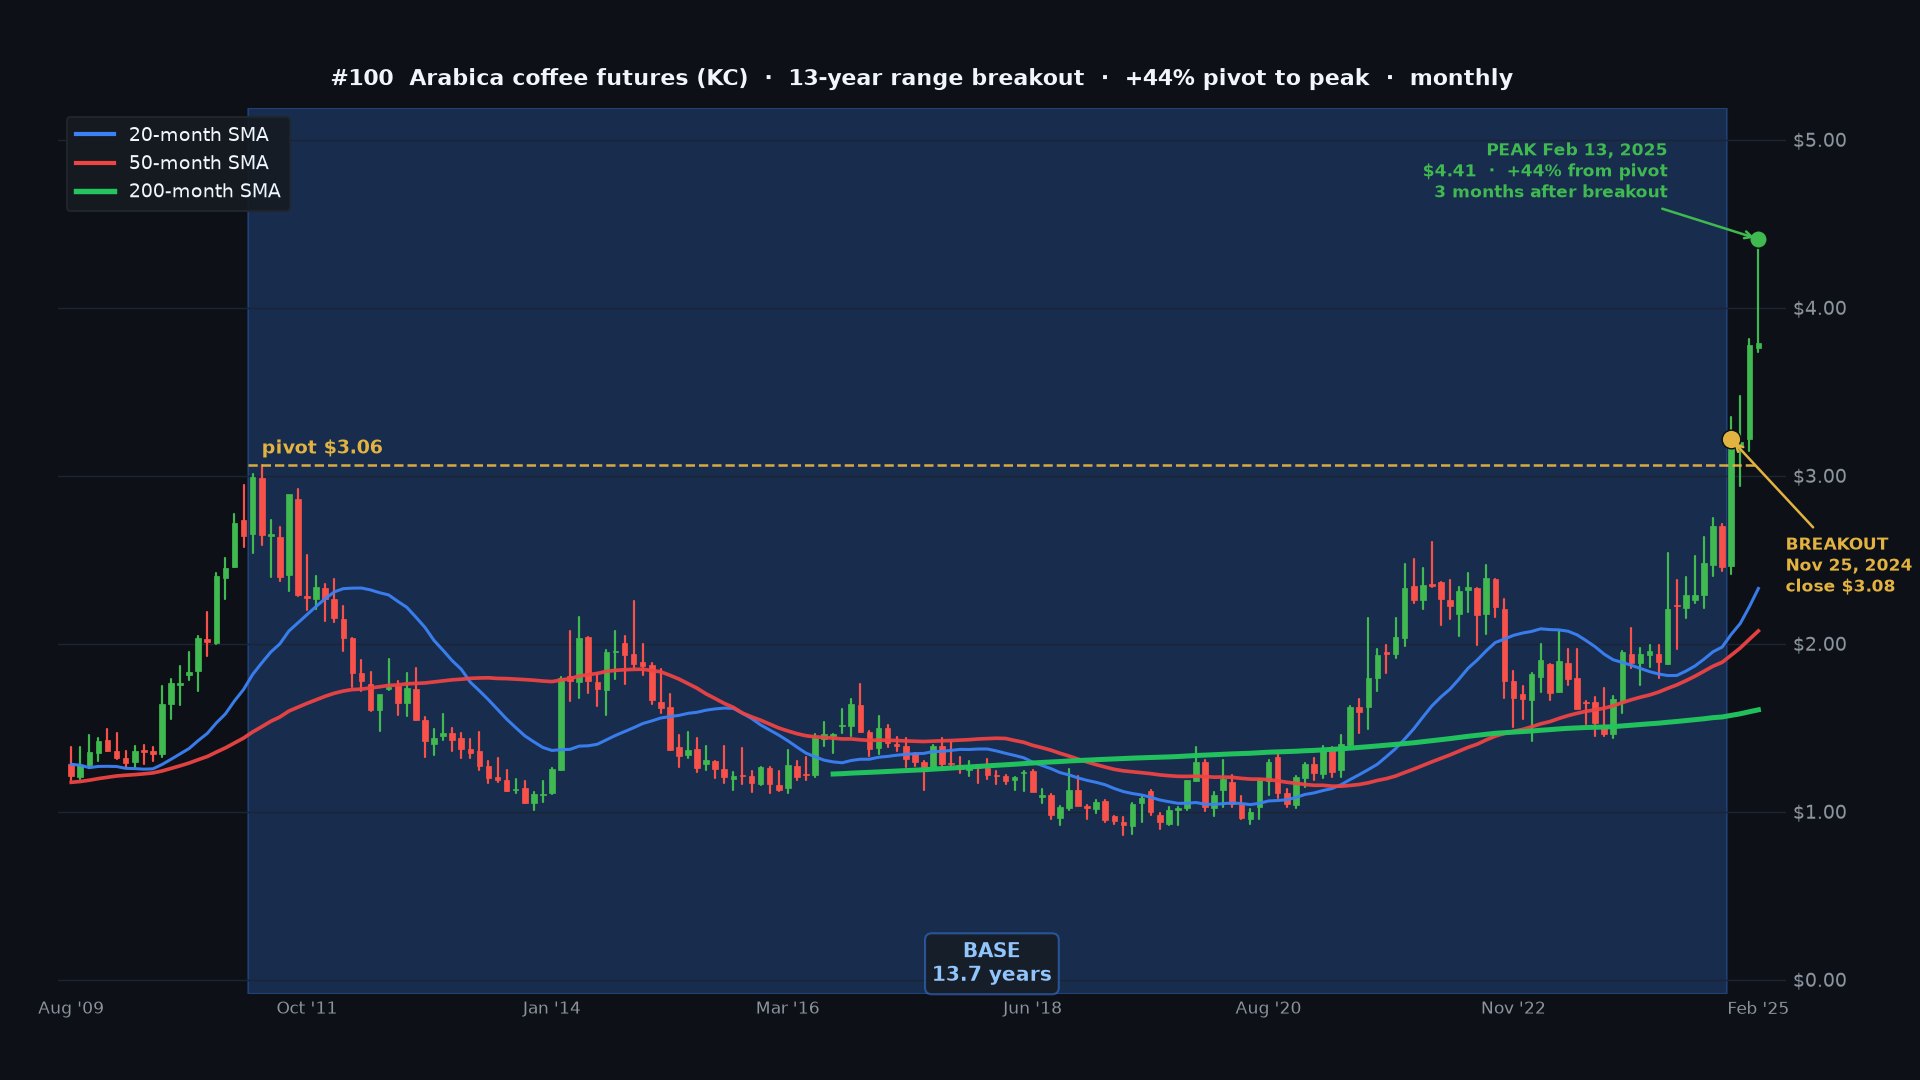
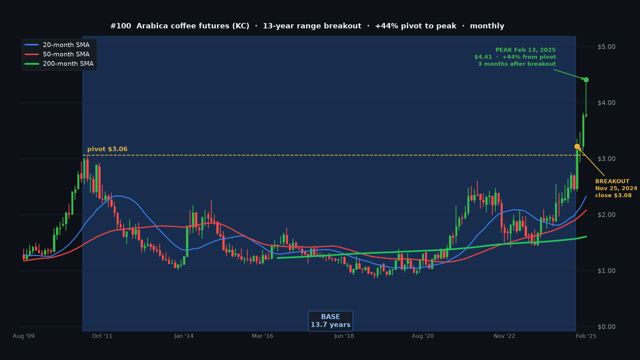 #100 Arabica coffee futures · +44.0%
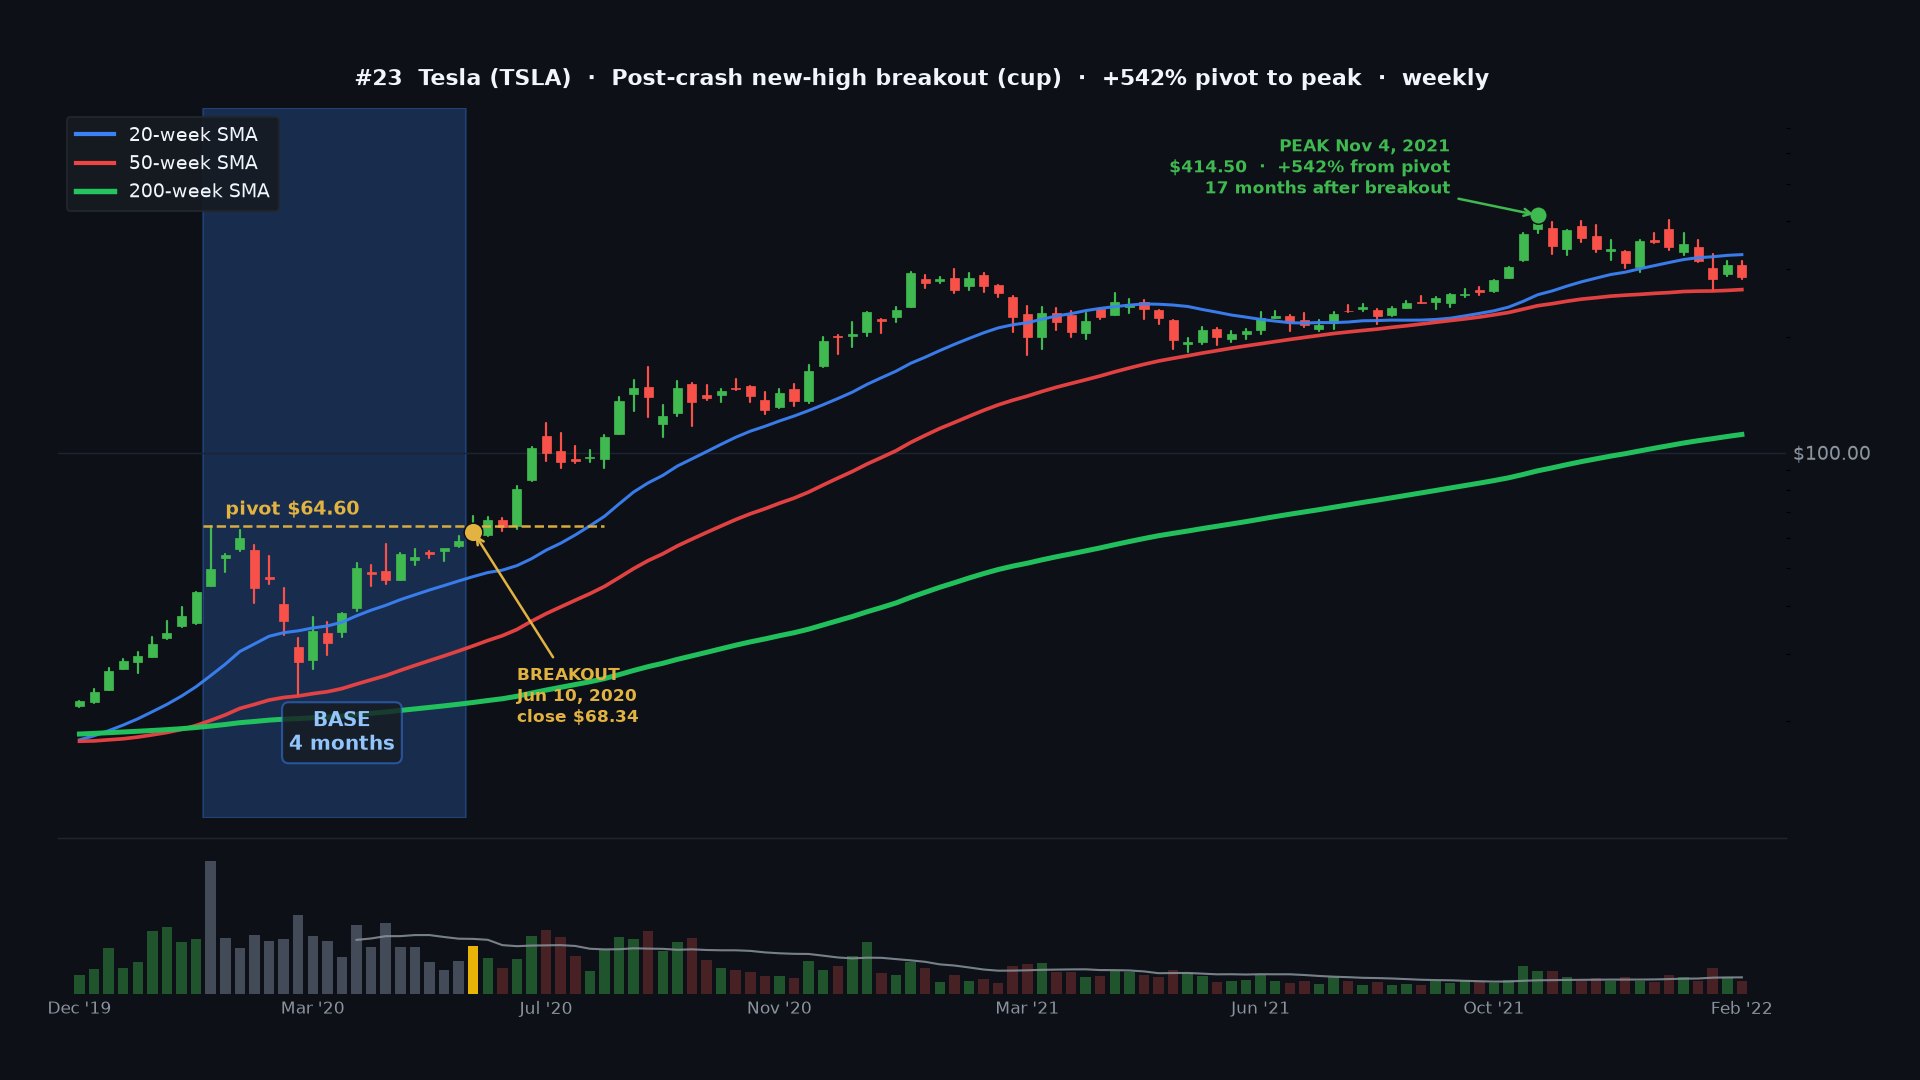
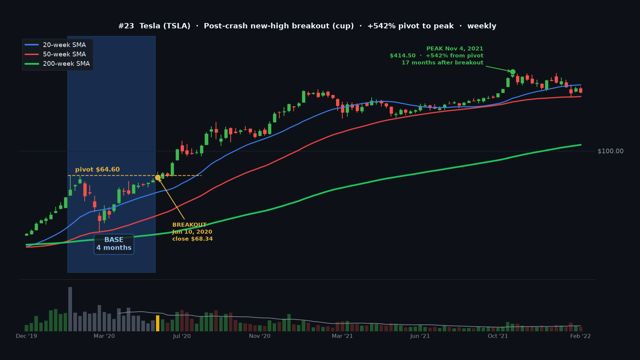 #23 Tesla · +542%
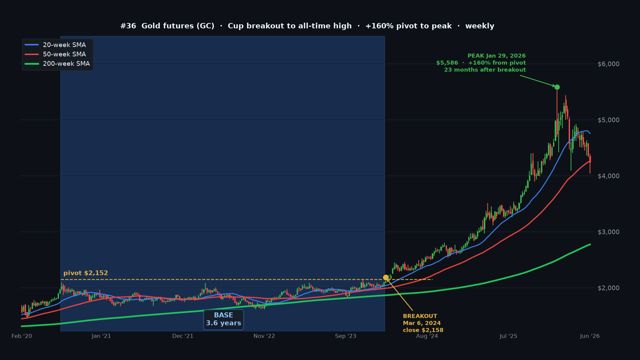 #36 Gold futures · +160%
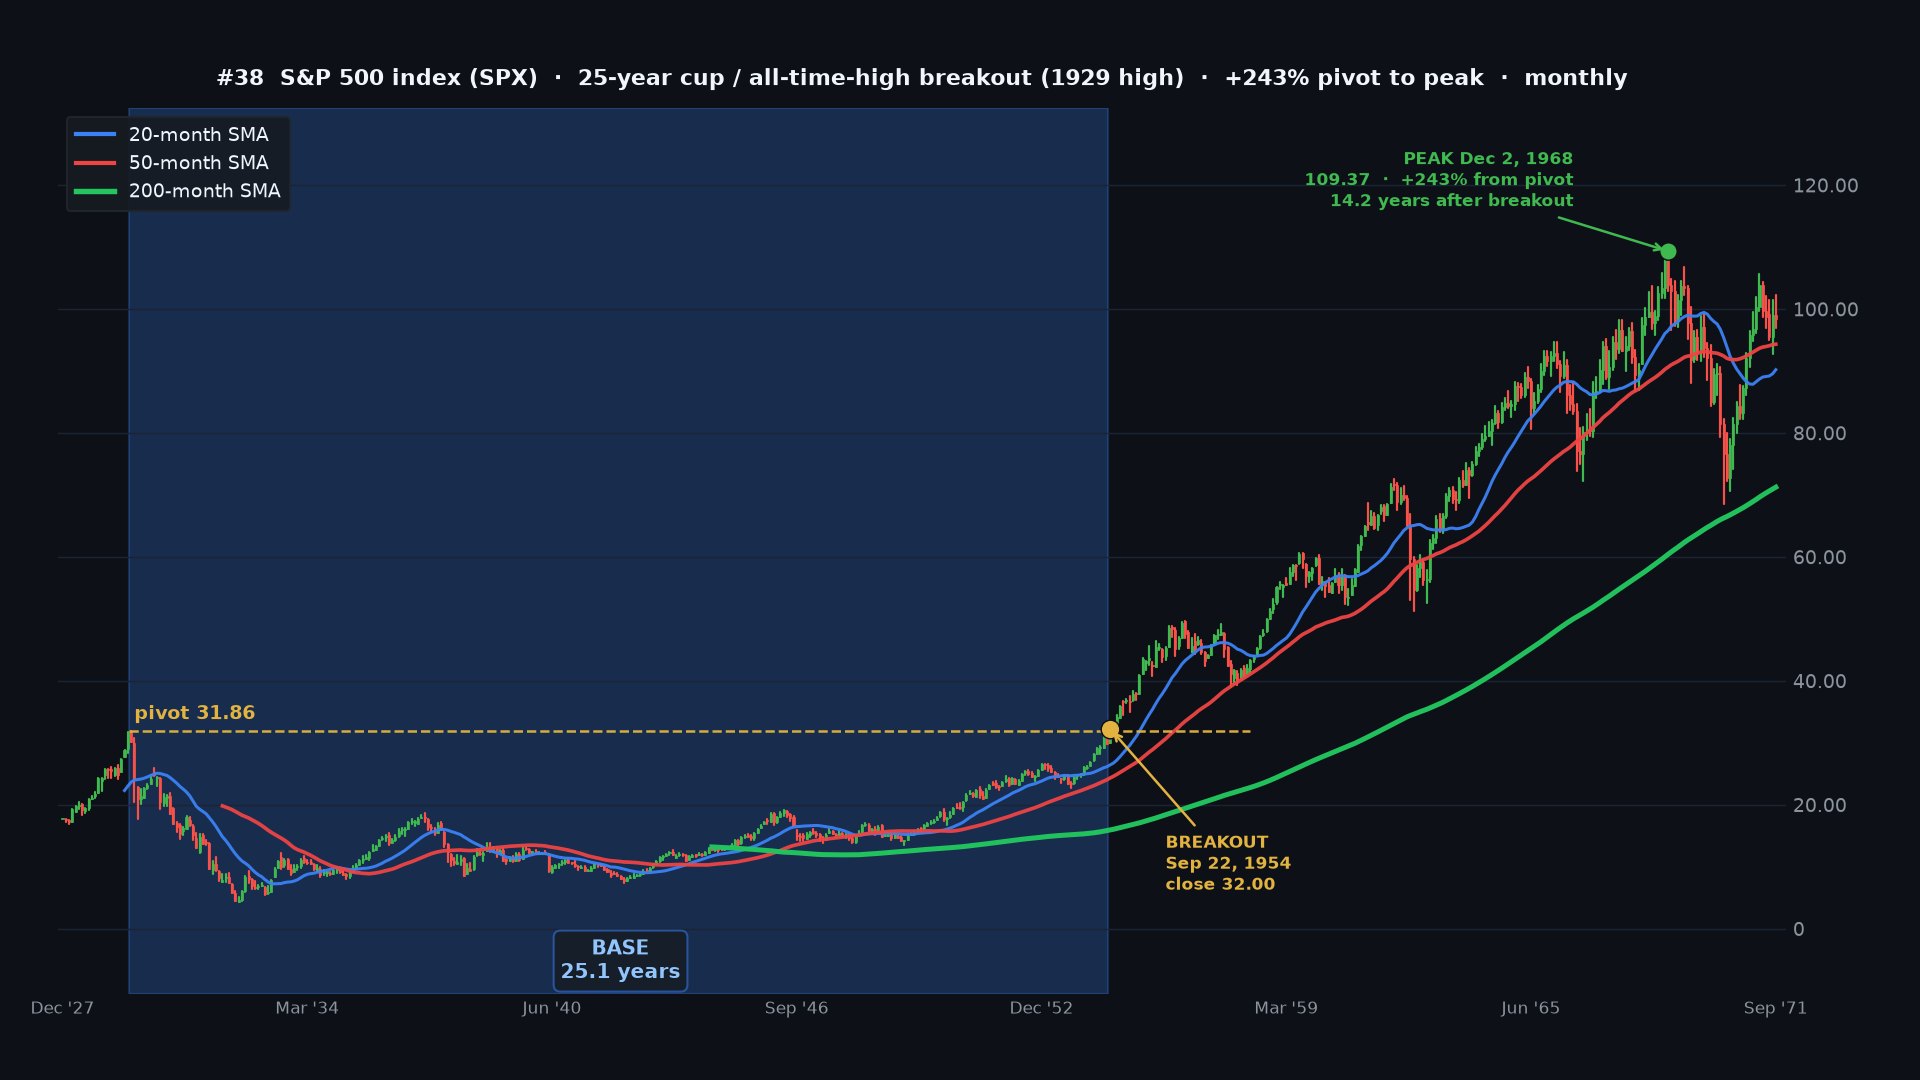
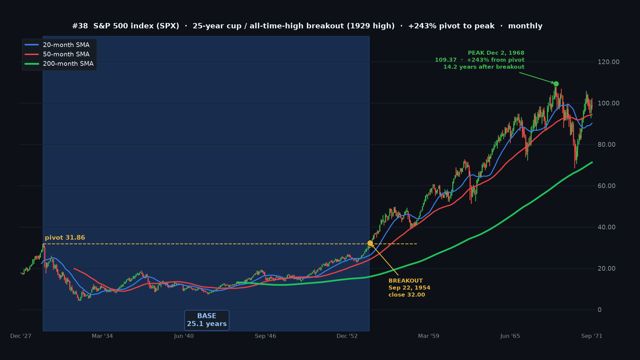 #38 S&P 500 index · +243%
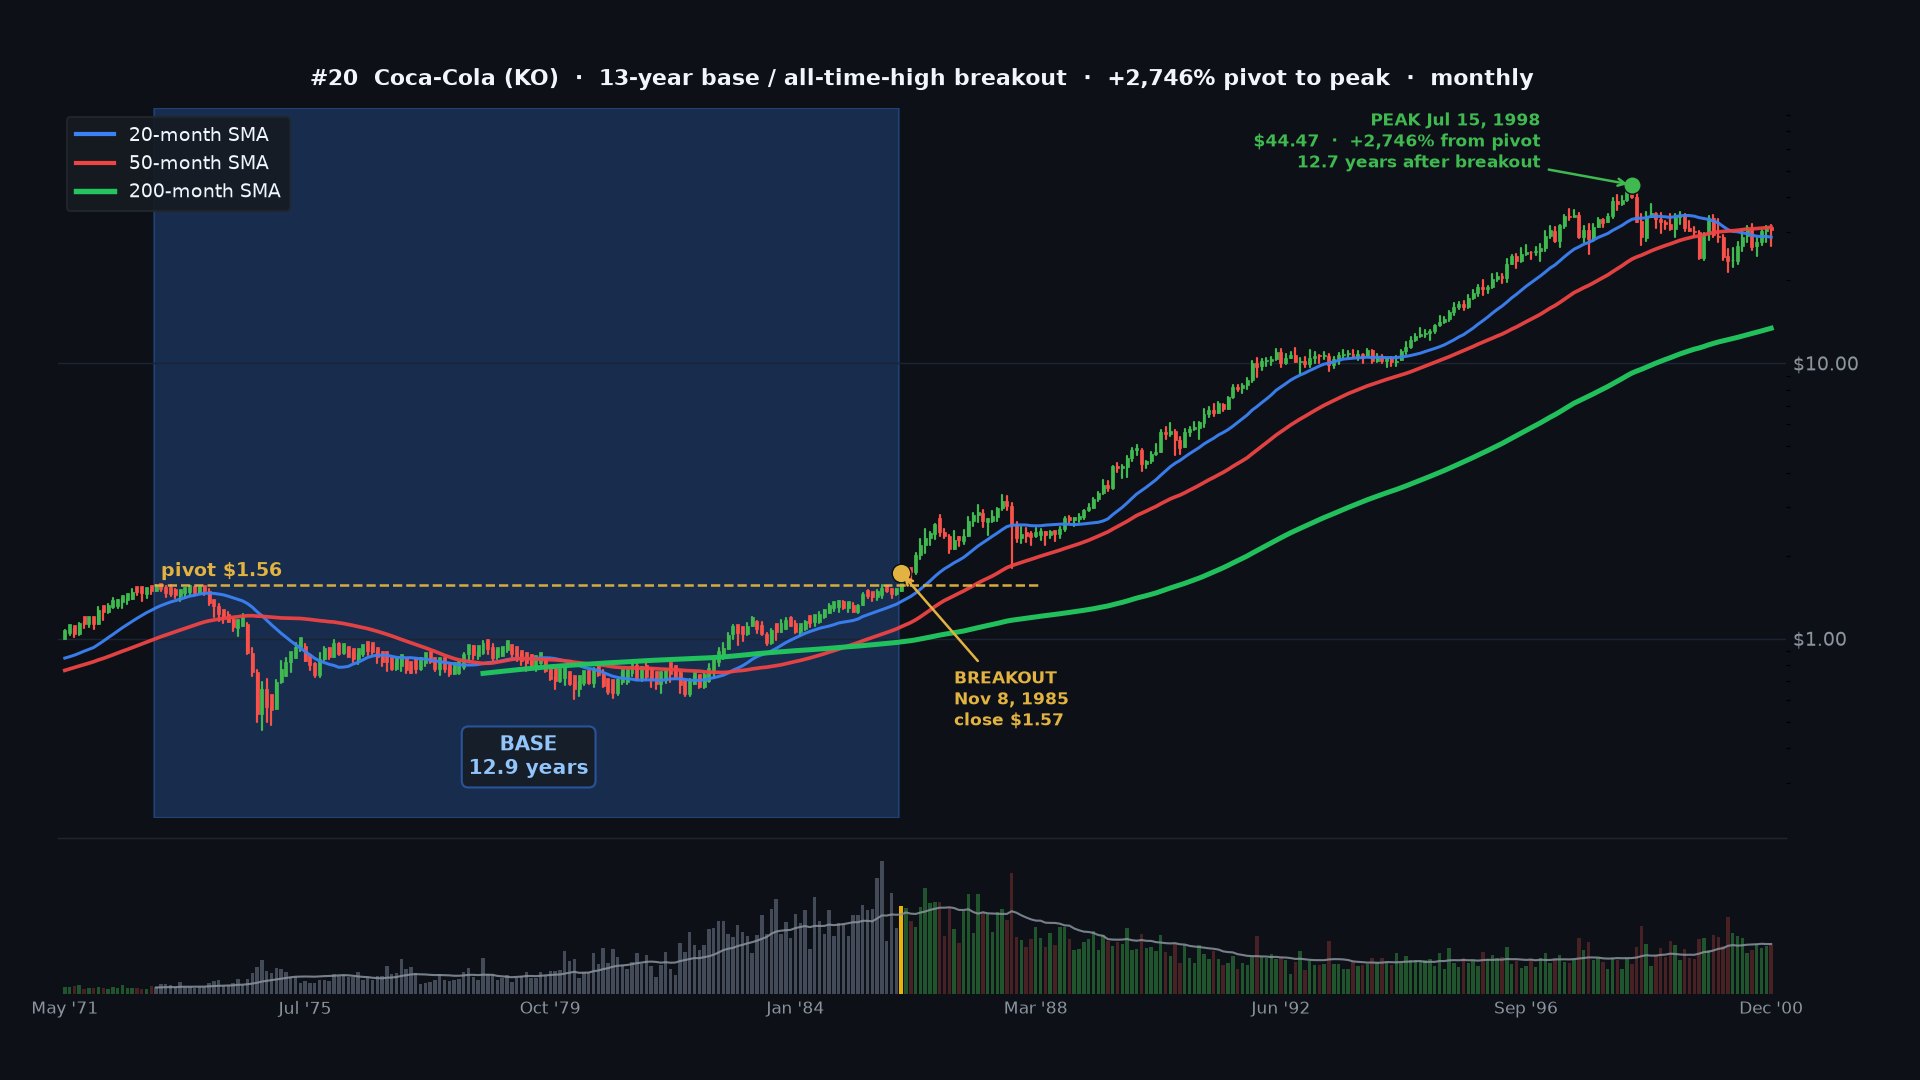
 #20 Coca-Cola · +2,746%#14 Walmart · +7,740%
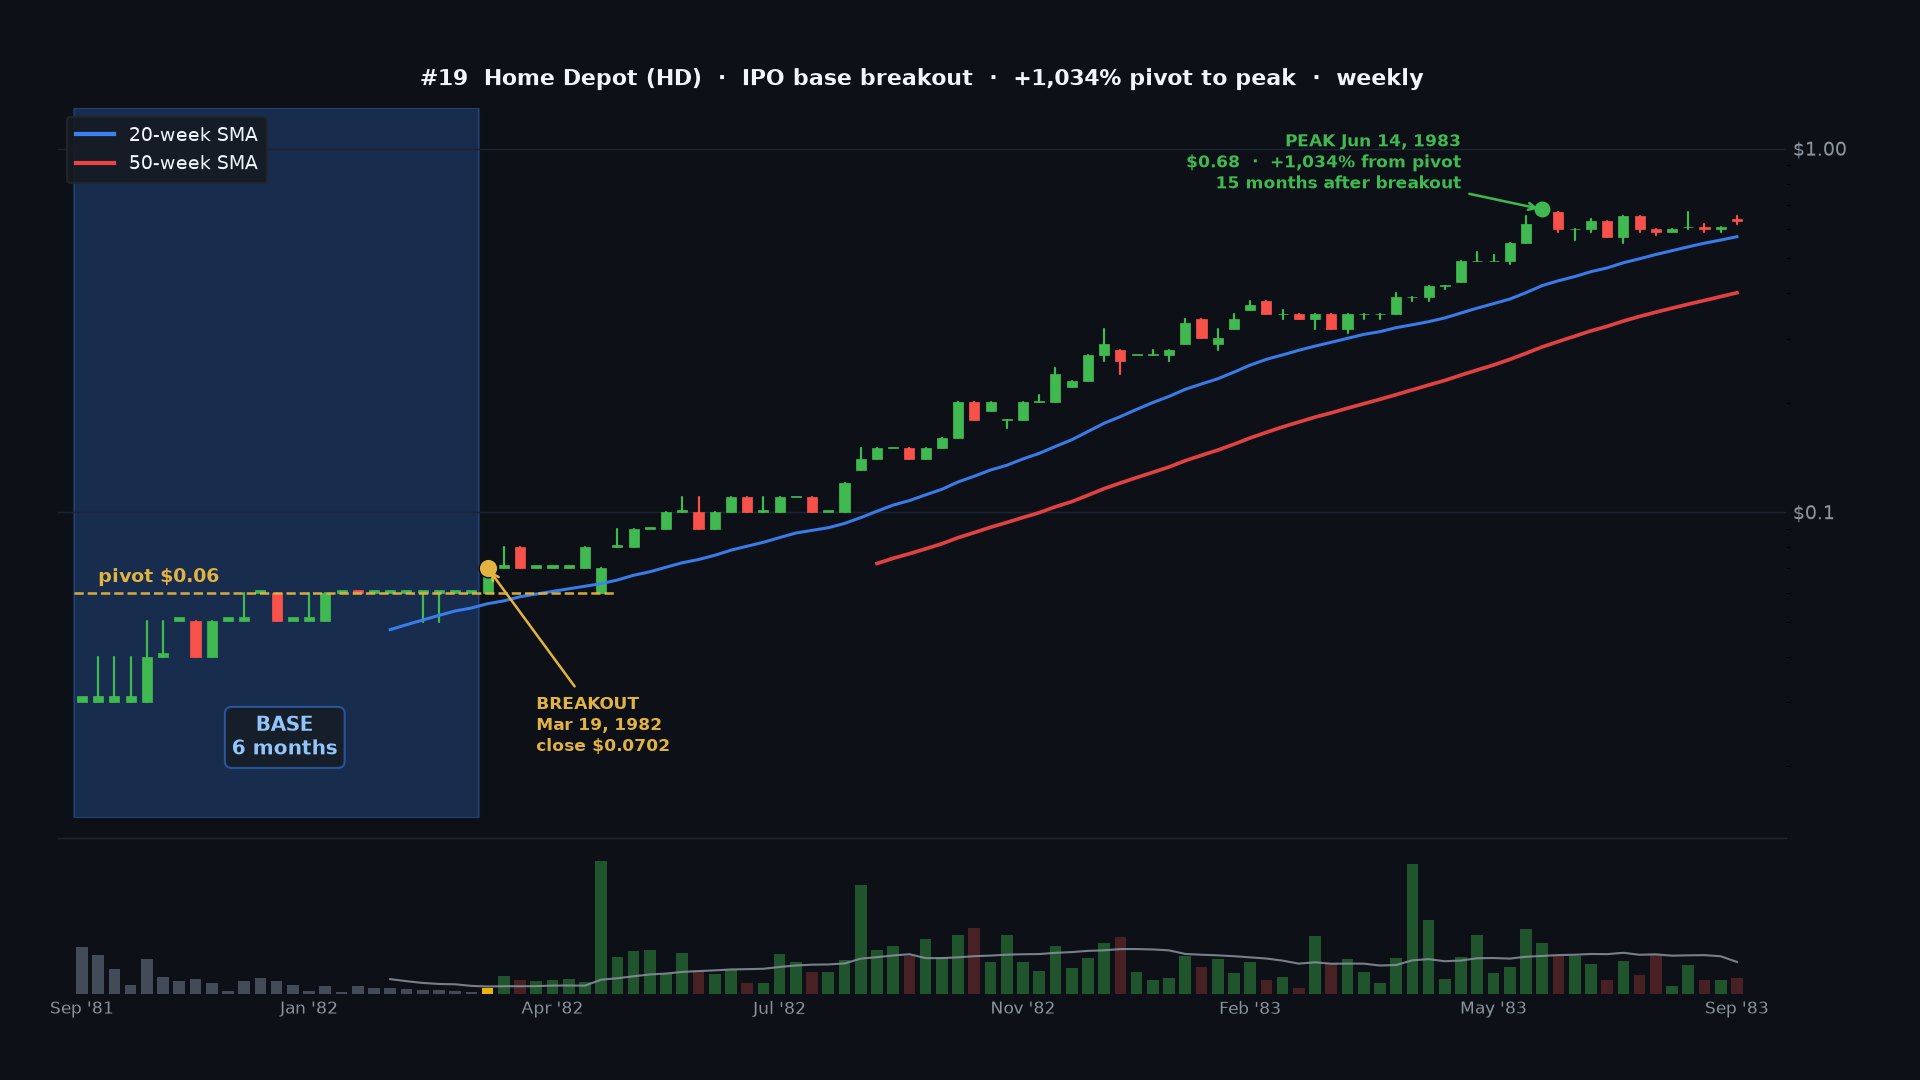
 #19 Home Depot · +1,034%
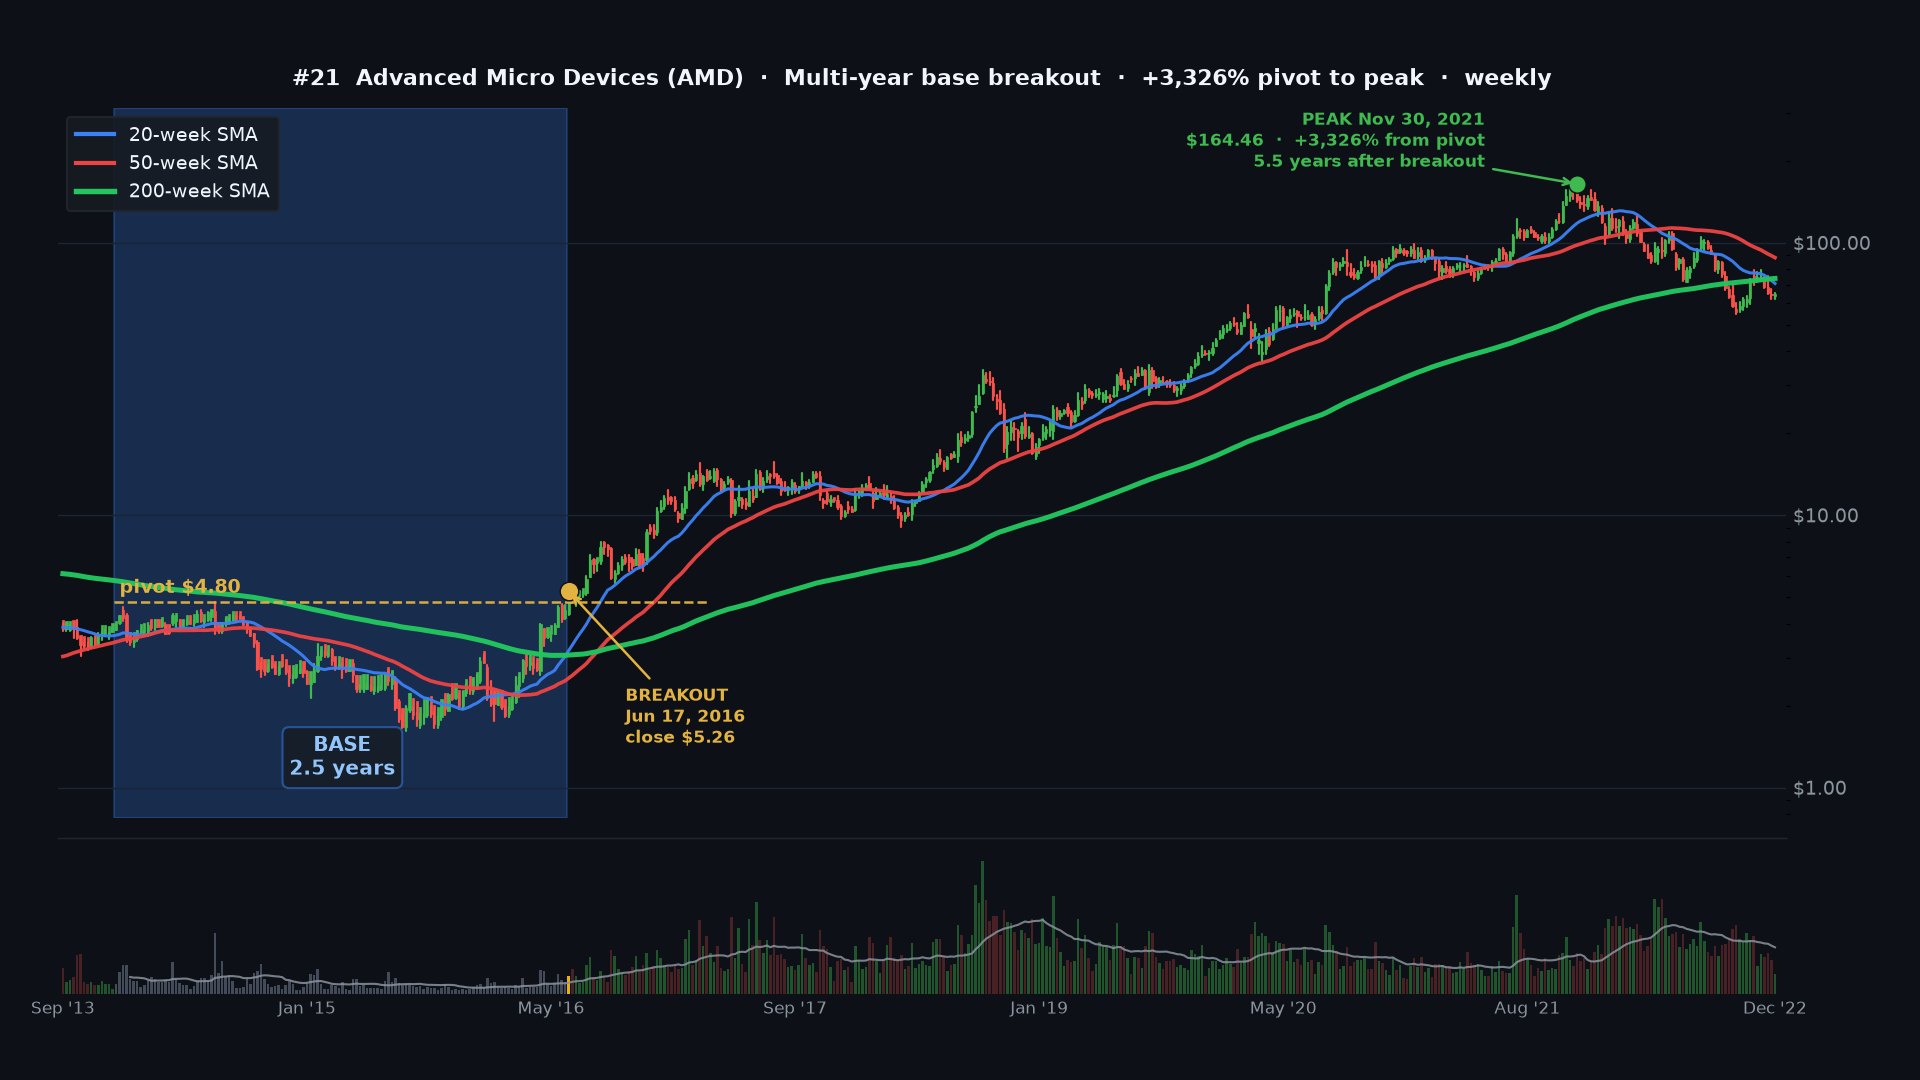
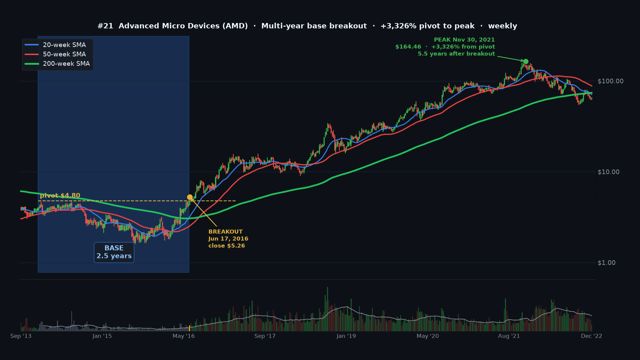 #21 Advanced Micro Devices · +3,326%
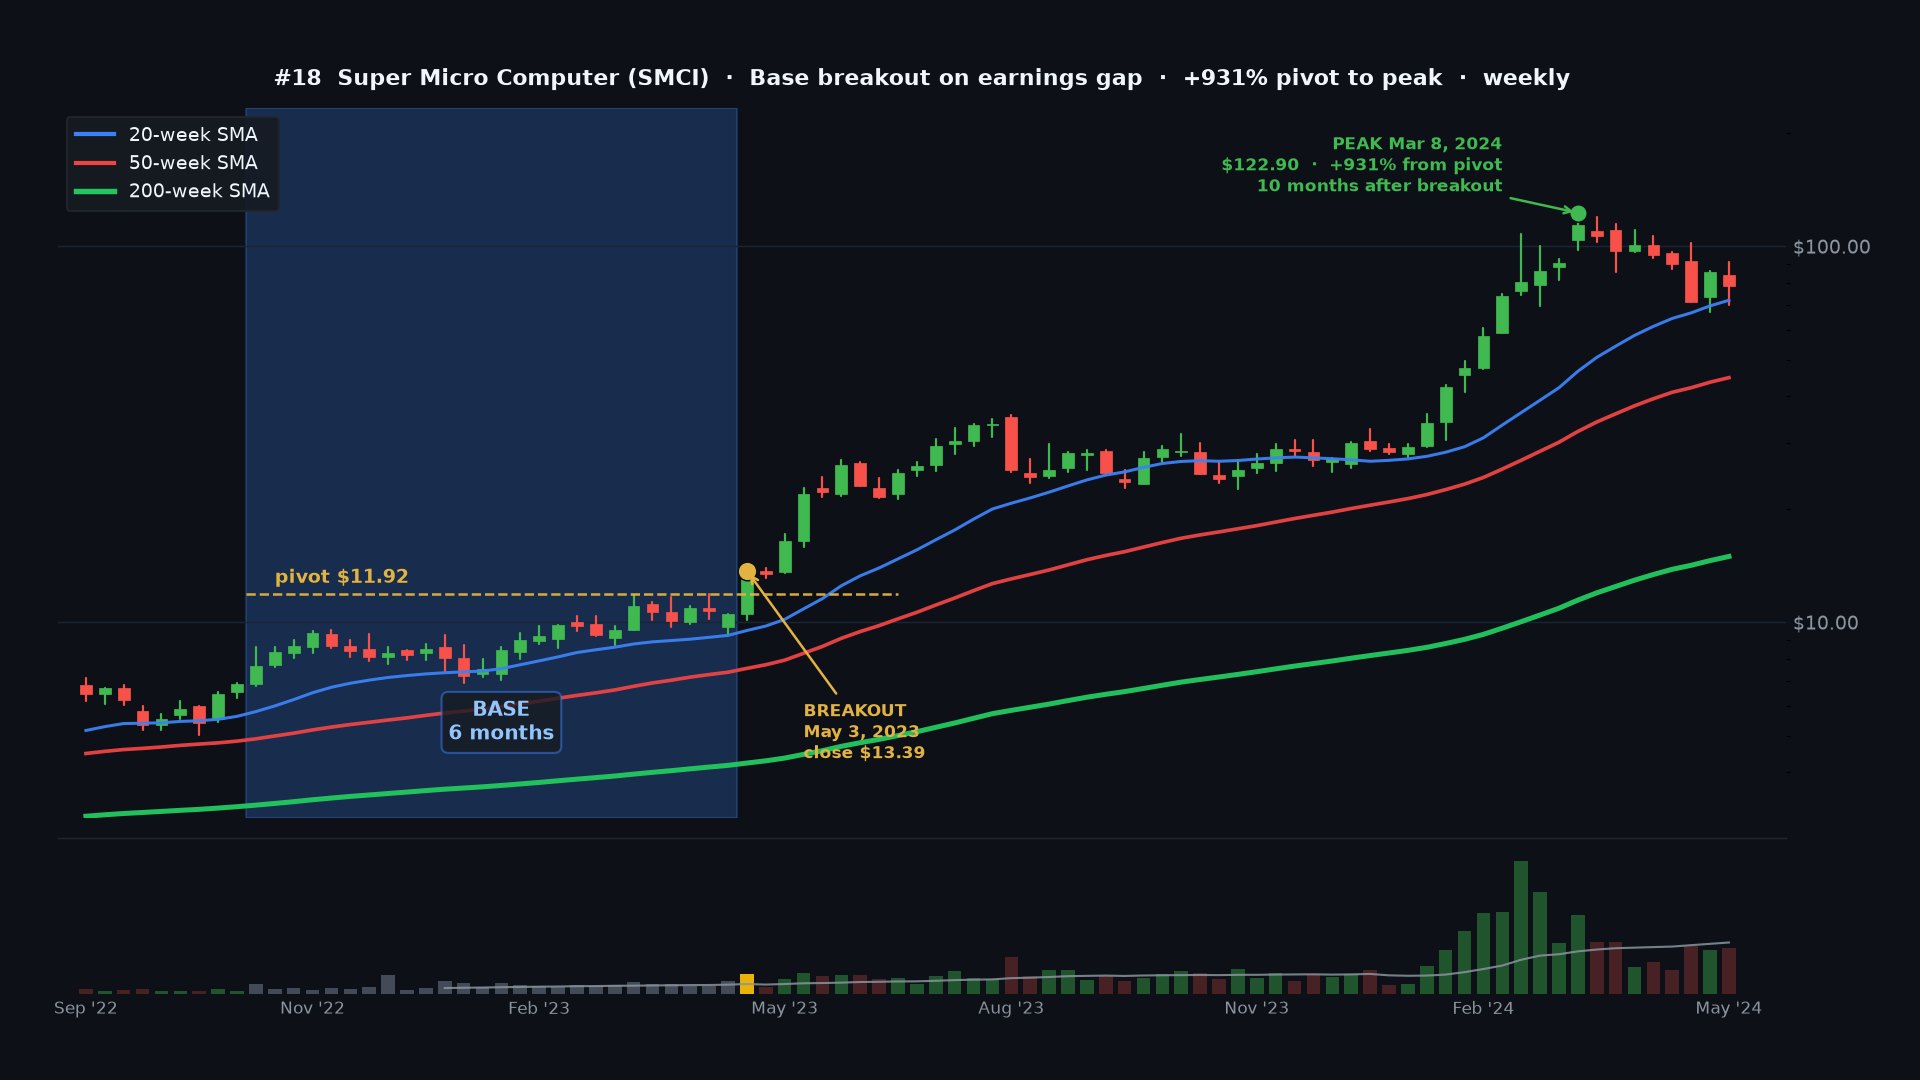
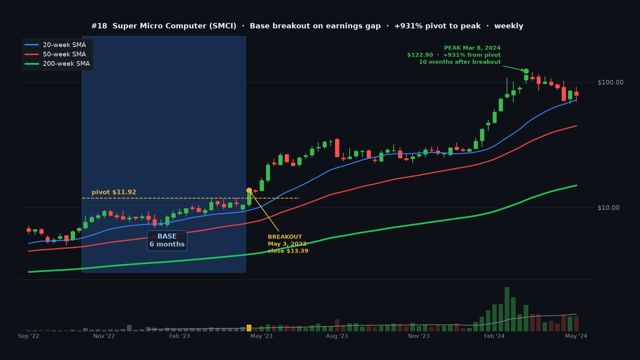 #18 Super Micro Computer · +931%
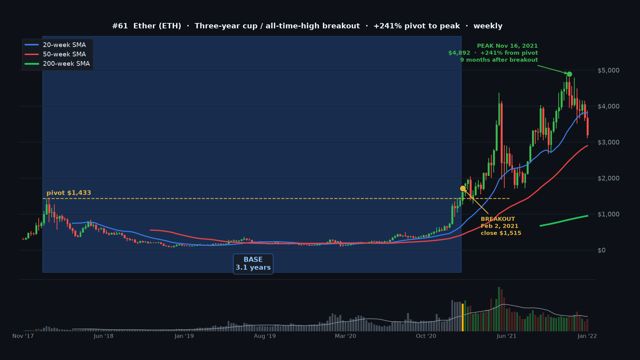 #61 Ether · +241%
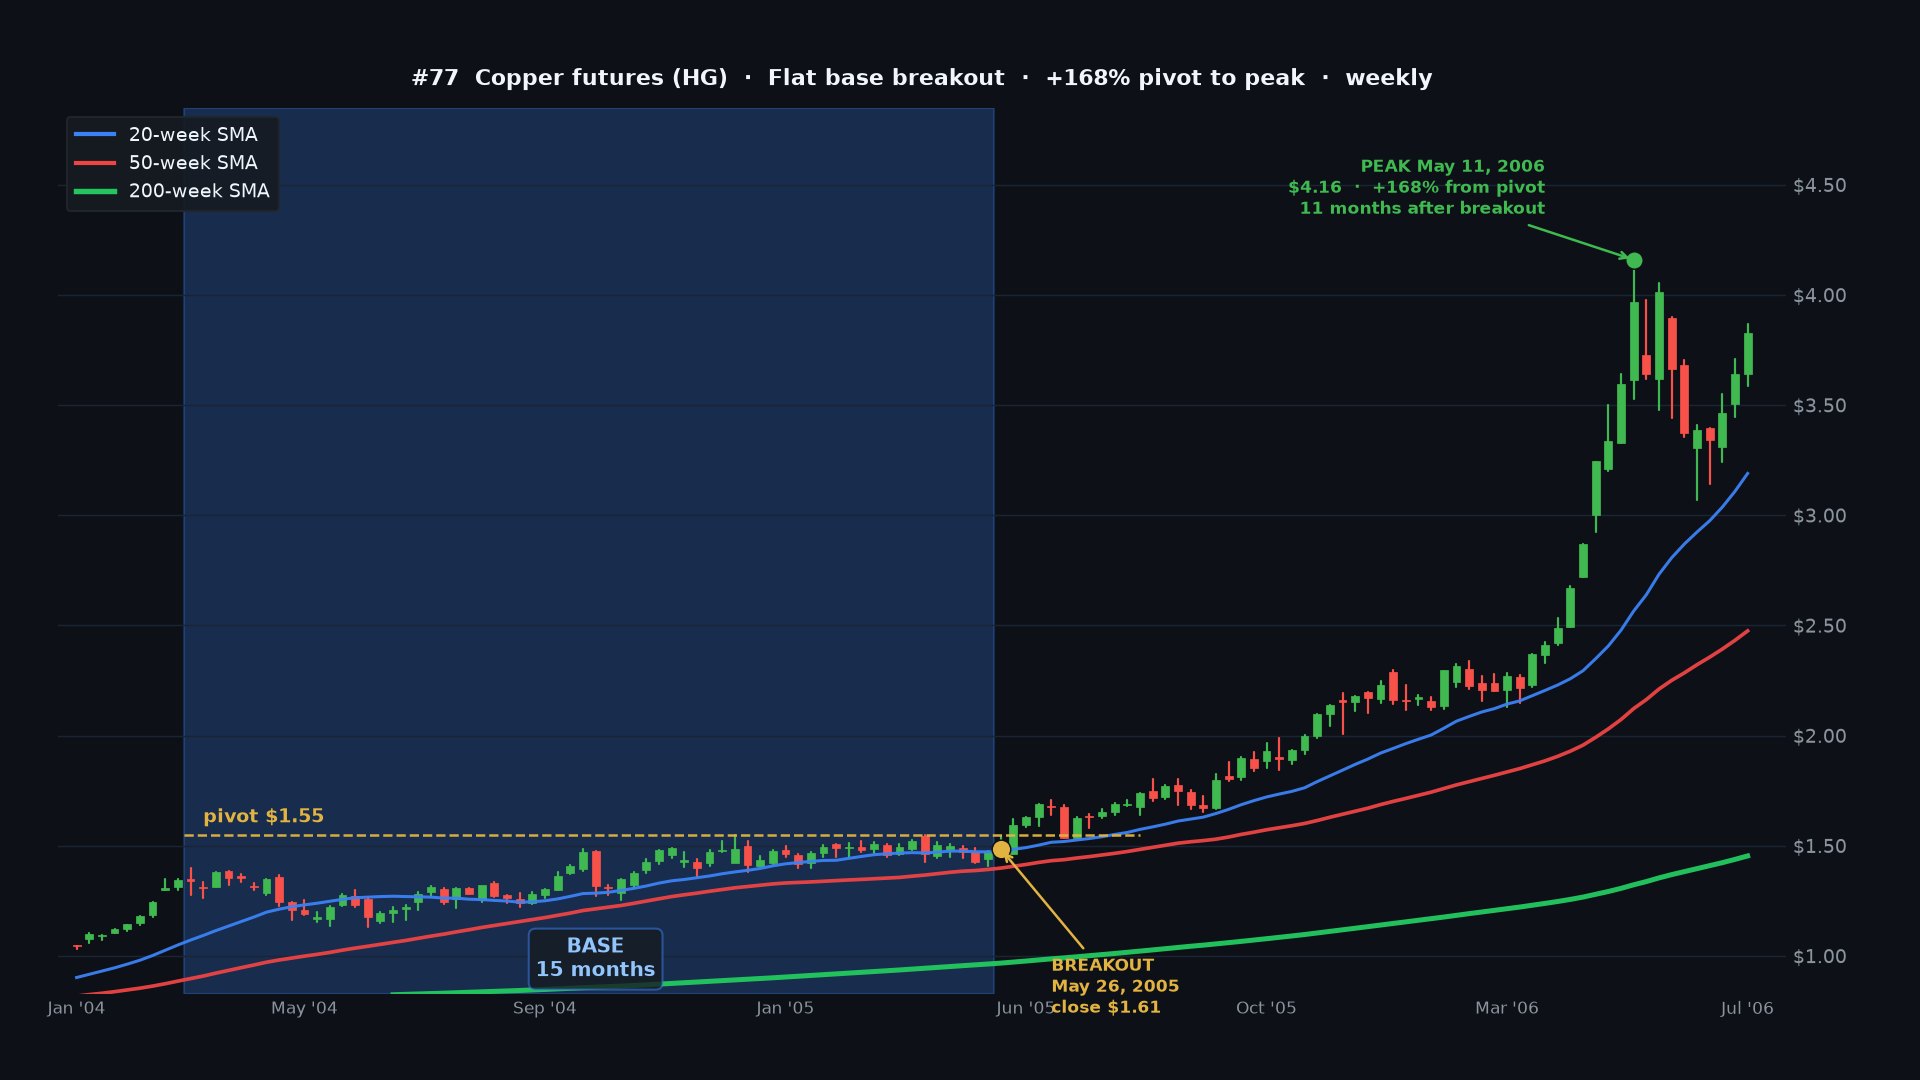
 #77 Copper futures · +168%
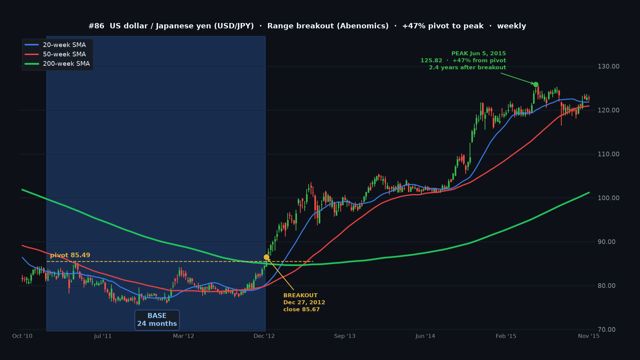 #86 US dollar / Japanese yen · +47.2%
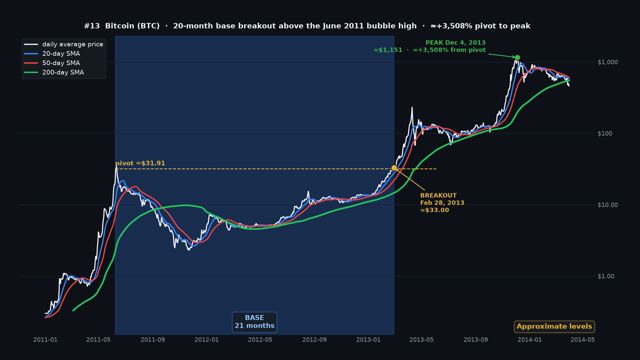
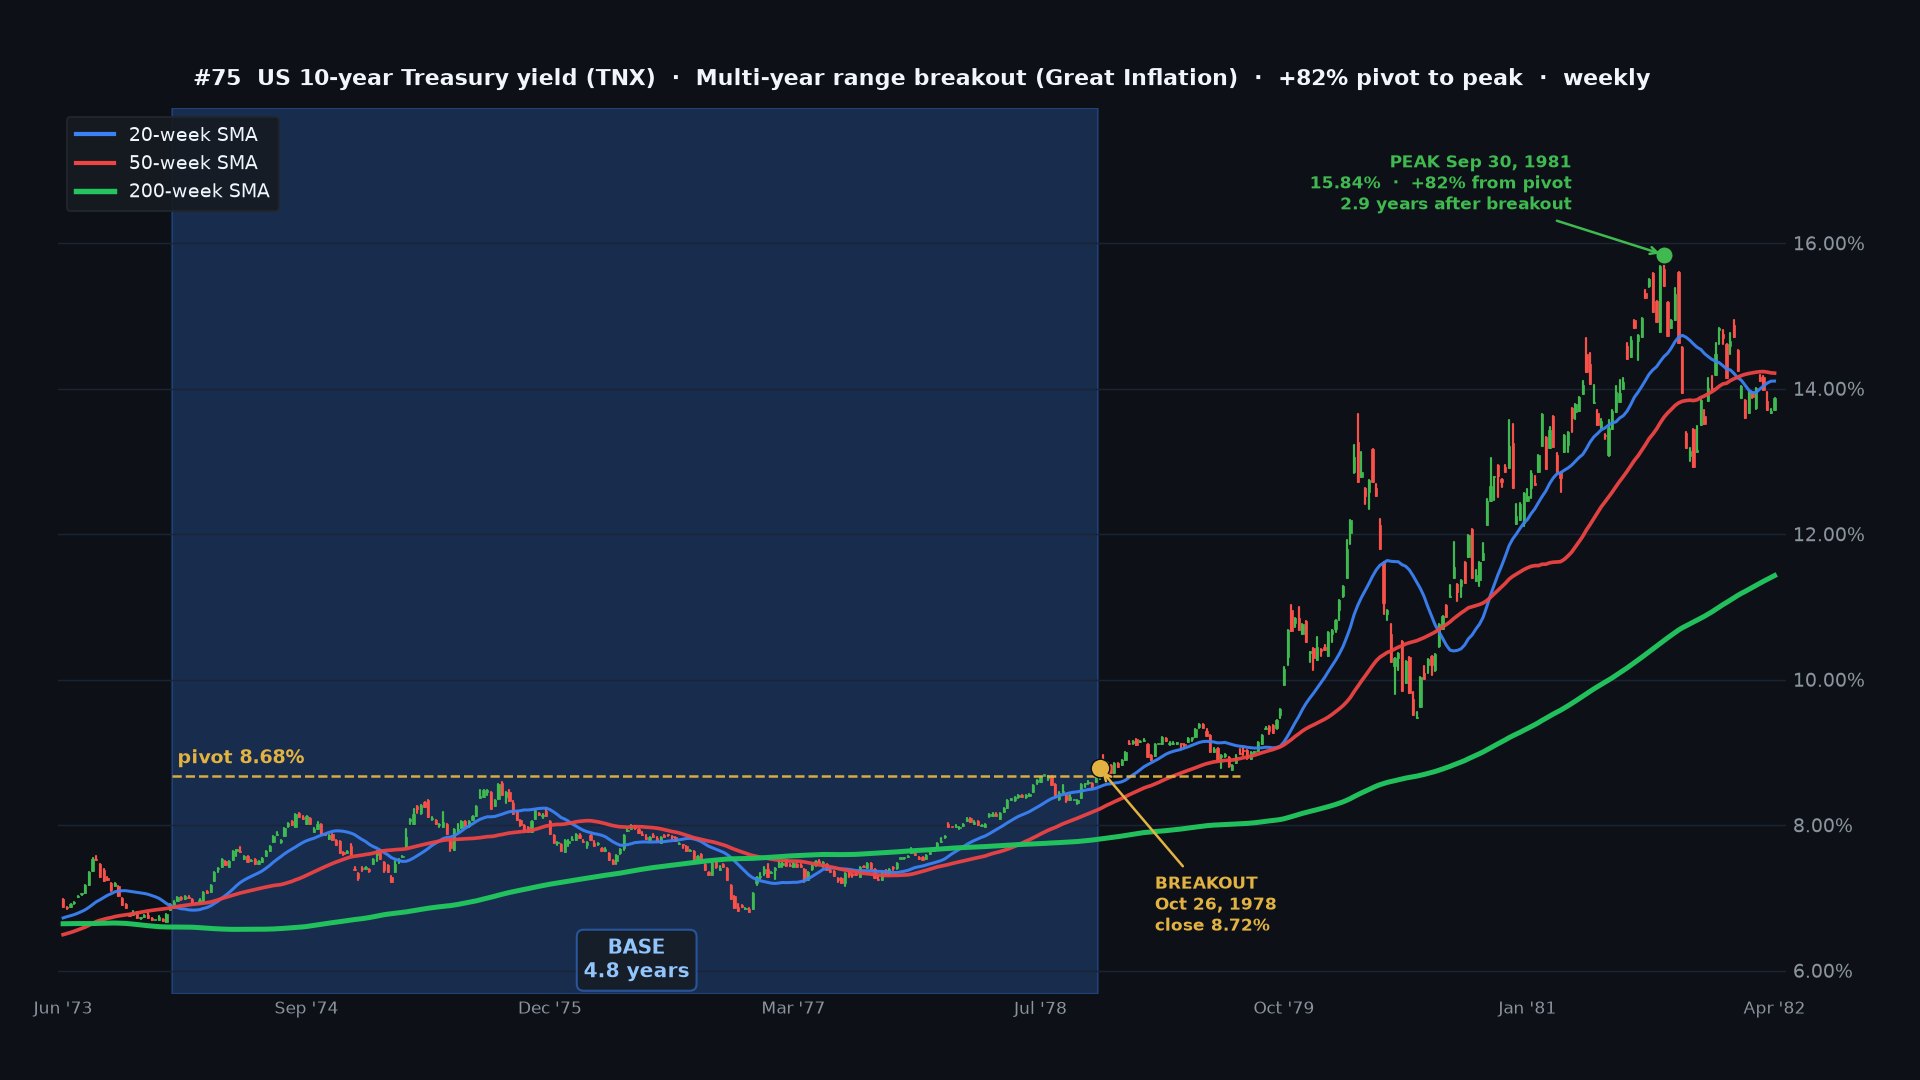
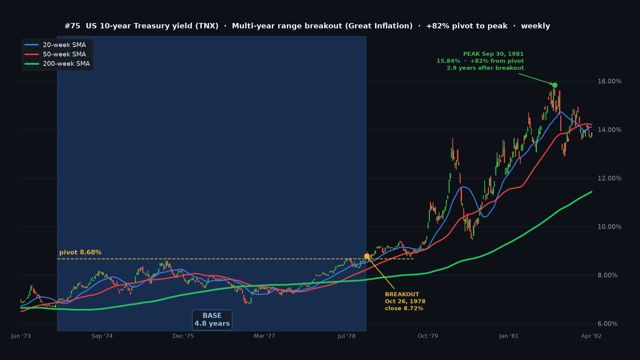 #75 US 10-year Treasury yield · +82.5%#13 Bitcoin · +3,508%
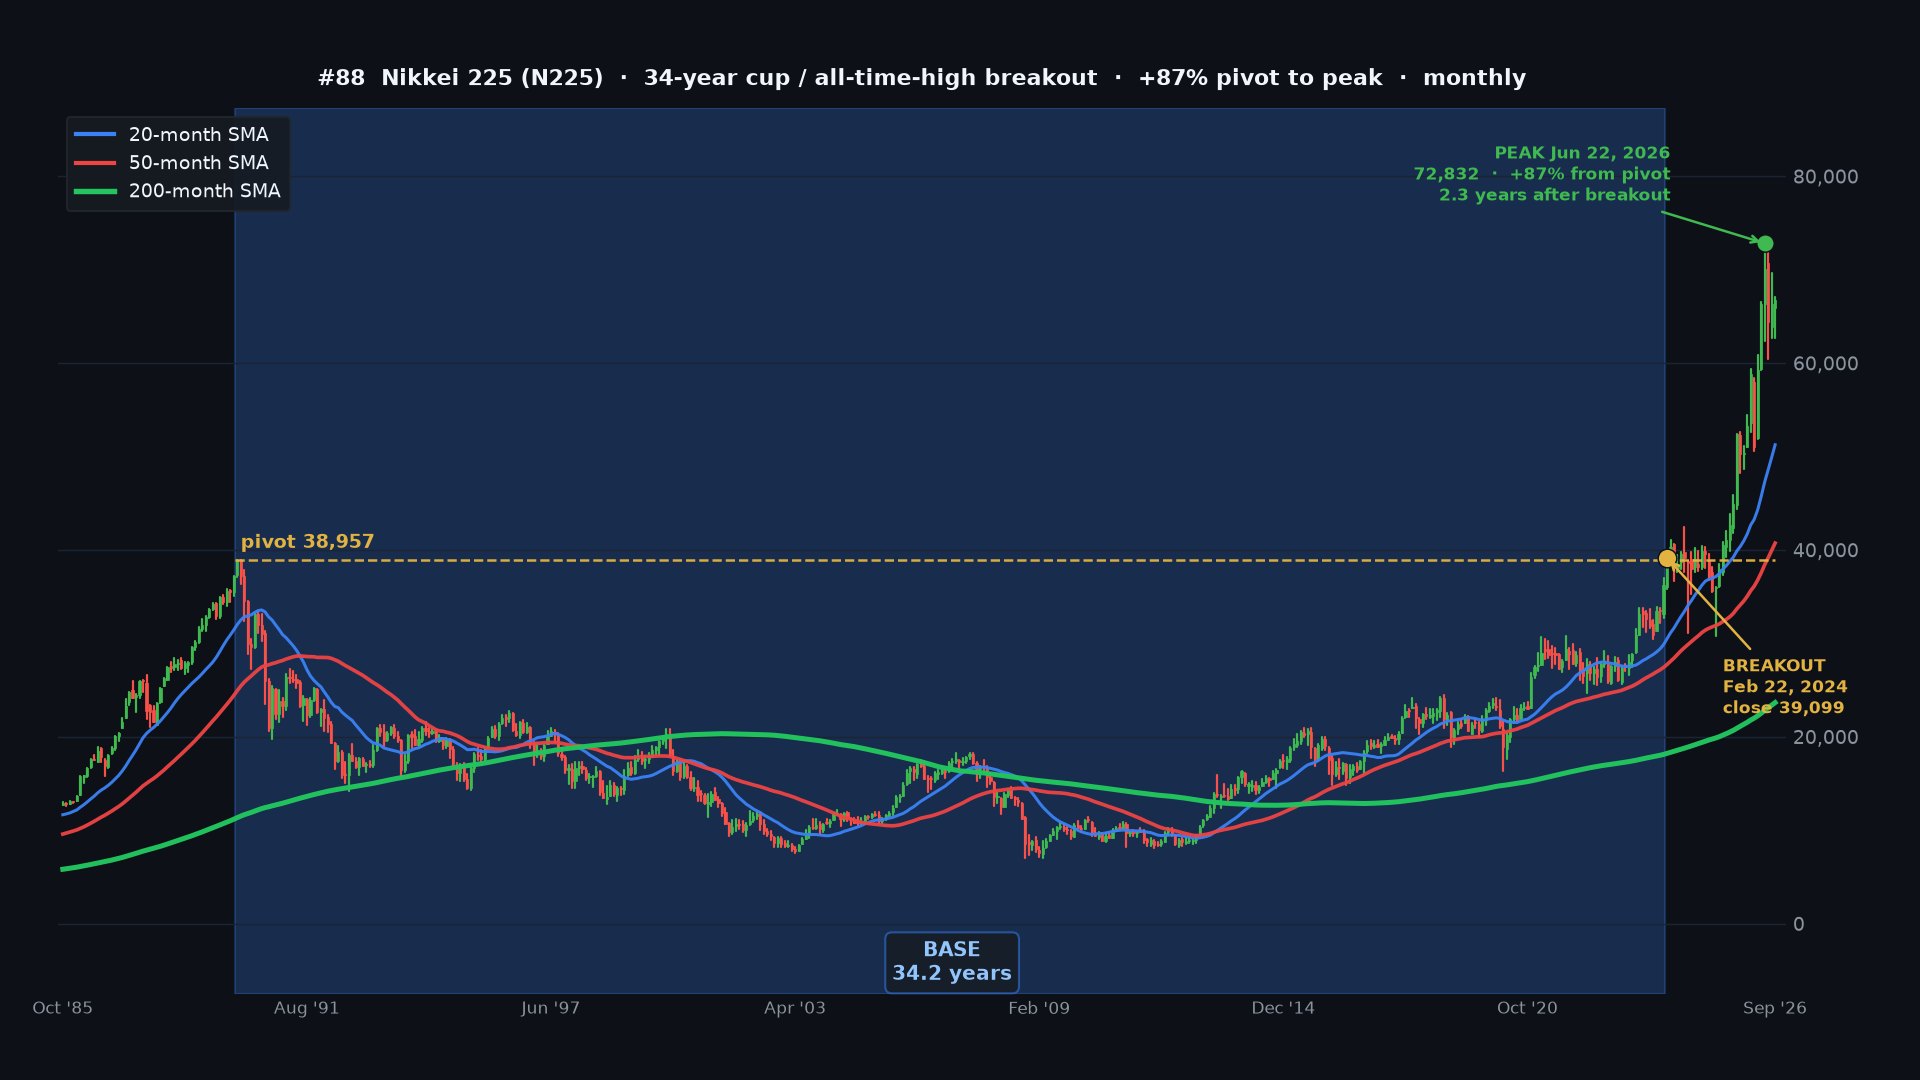
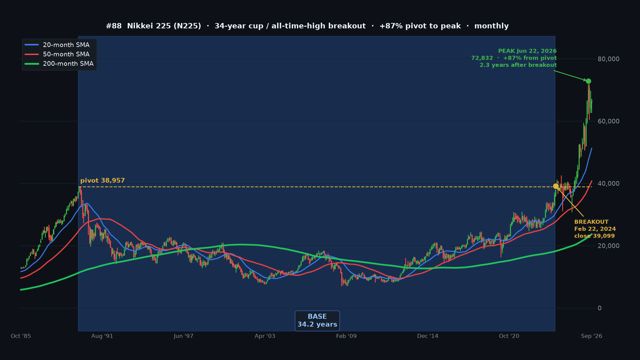 #88 Nikkei 225 · +87.0%
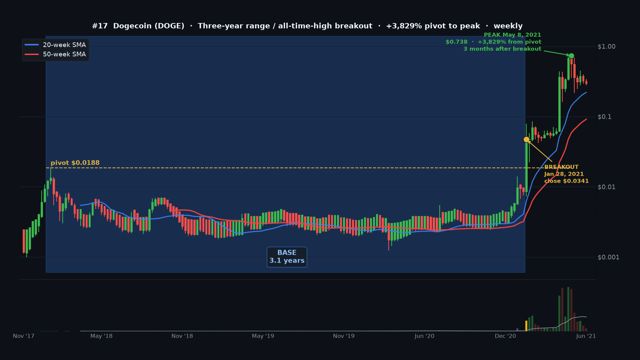 #17 Dogecoin · +3,829%
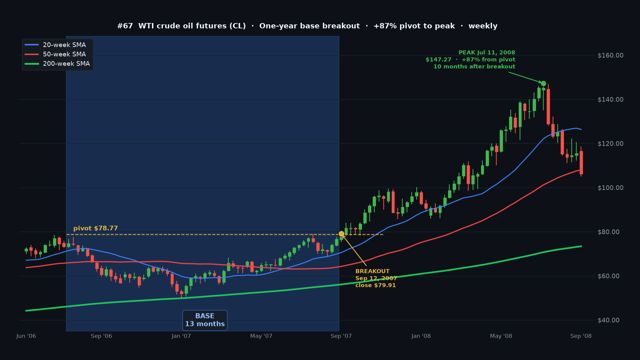 #67 WTI crude oil futures · +87.0%
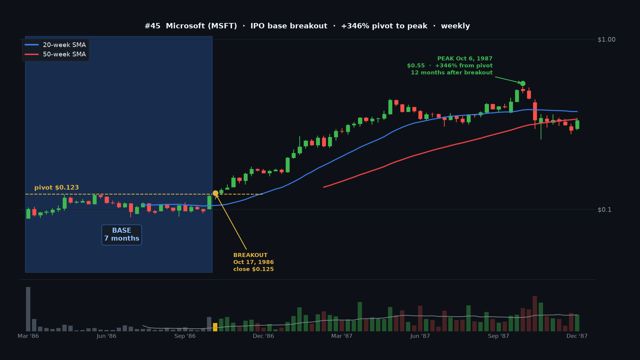 #45 Microsoft · +346%#16 Solana · +5,159%
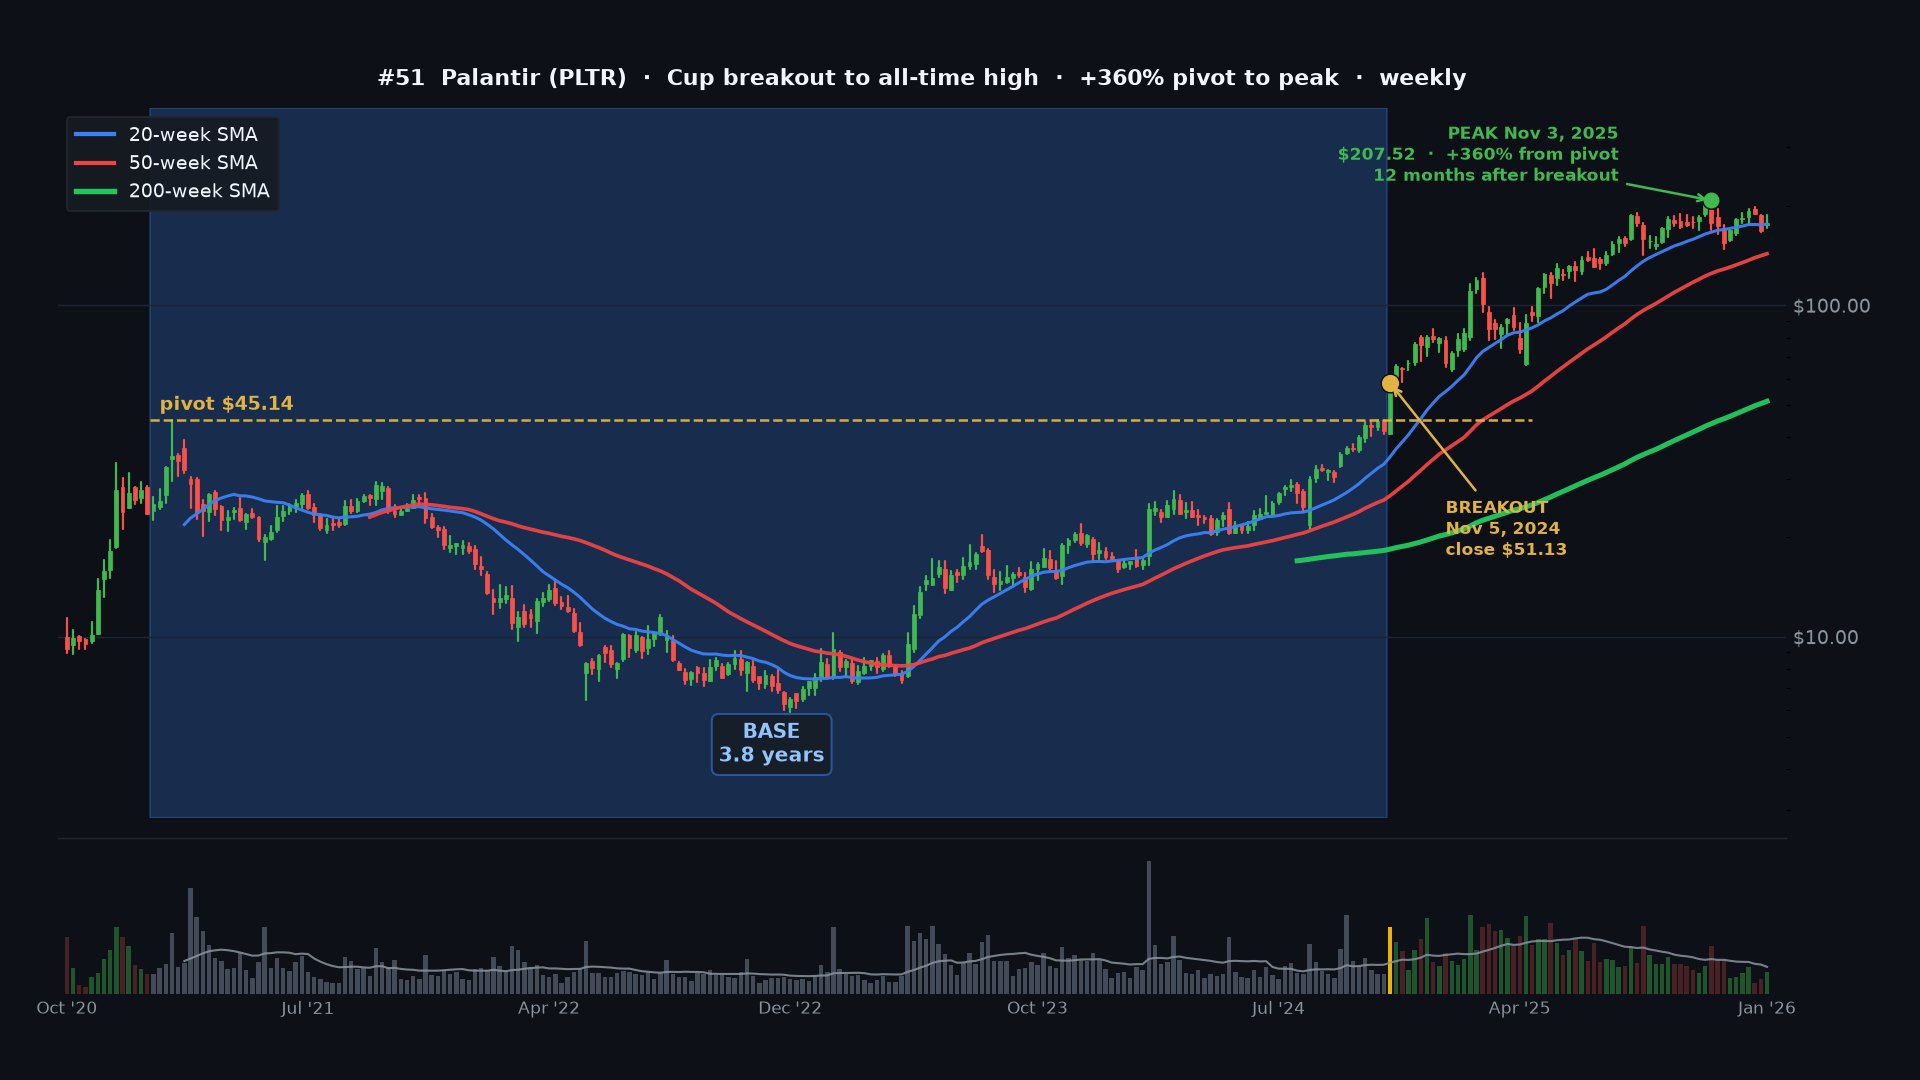
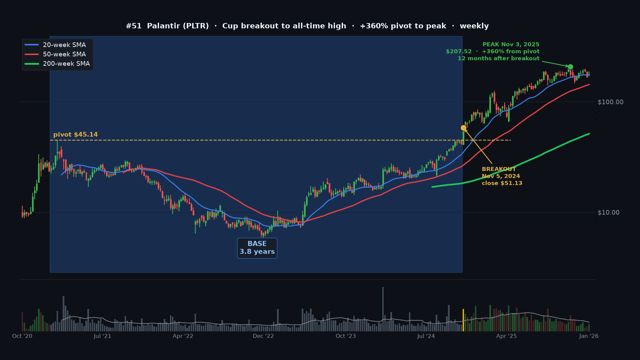 #51 Palantir · +360%







Every major market, a century of breakouts
The same patterns show up everywhere: a 1920s bull market, the 1970s gold rush, the dot-com leaders, crypto cycles and today’s AI winners. Seeing them across markets is what makes them easy to recognize.
The countdown, from #100
Here’s #100 through #11. The top 10 stay locked until you’re inside. Can you guess #1?
| #100 | Arabica coffee futures, 2024 | Commodity | +44.0% |
| #99 | 20+ Year Treasury Bond ETF, 2019 | Bonds/rates | +25.1% |
| #98 | 20+ Year Treasury Bond ETF, 2008 | Bonds/rates | +22.1% |
| #97 | US Dollar Index, 2014 | Currency | +15.8% |
| #96 | Natural gas futures, 2021 | Commodity | +103% |
| #95 | US dollar / Japanese yen, 2022 | Currency | +20.8% |
| #94 | Chipotle, 2007 | US stock | +129% |
| #93 | Bitcoin, 2024 | Crypto | +83.5% |
| #92 | VanEck Gold Miners ETF, 2025 | ETF | +156% |
| #91 | Shanghai Composite, 2014 | Index | +112% |
| #90 | WTI crude oil futures, 2004 | Commodity | +87.3% |
| #89 | Wheat futures, 2007 | Commodity | +140% |
| #88 | Nikkei 225, 2024 | Index | +87.0% |
| #87 | Invesco Solar ETF, 2020 | ETF | +201% |
| #86 | US dollar / Japanese yen, 2012 | Currency | +47.2% |
| #85 | SoftBank Group, 2005 | Global stock | +172% |
| #84 | VanEck Semiconductor ETF, 2023 | ETF | +317% |
| #83 | Platinum futures, 2025 | Commodity | +121% |
| #82 | US dollar / Turkish lira, 2021 | Currency | +106% |
| #81 | Brazil Bovespa, 2003 | Index | +288% |
| #80 | BYD, 2020 | Global stock | +469% |
| #79 | US 10-year Treasury yield, 2022 | Bonds/rates | +53.8% |
| #78 | Eli Lilly, 2023 | US stock | +244% |
| #77 | Copper futures, 2005 | Commodity | +168% |
| #76 | Palladium futures, 2018 | Commodity | +153% |
| #75 | US 10-year Treasury yield, 1978 | Bonds/rates | +82.5% |
| #74 | Crocs, 2006 | US stock | +306% |
| #73 | Gold futures, 2019 | Commodity | +50.2% |
| #72 | ARK Innovation ETF, 2020 | ETF | +163% |
| #71 | BSE Sensex, 2004 | Index | +239% |
| #70 | XRP, 2024 | Crypto | +301% |
| #69 | Dow Jones Industrial Average, 1924 | Index | +219% |
| #68 | KOSPI (South Korea), 2025 | Index | +183% |
| #67 | WTI crude oil futures, 2007 | Commodity | +87.0% |
| #66 | S&P 500 index, 2013 | Index | +115% |
| #65 | Oracle, 1999 | US stock | +352% |
| #64 | Silver futures, 2010 | Commodity | +134% |
| #63 | Rheinmetall, 2024 | Global stock | +580% |
| #62 | Shanghai Composite, 2006 | Index | +173% |
| #61 | Ether, 2021 | Crypto | +241% |
| #60 | Xerox, 1963 | US stock | +705% |
| #59 | AppLovin, 2024 | US stock | +352% |
| #58 | Enphase Energy, 2019 | US stock | +678% |
| #57 | Nintendo, 2005 | Global stock | +416% |
| #56 | Dow Jones Industrial Average, 1982 | Index | +159% |
| #55 | MicroStrategy (Strategy), 2024 | US stock | +313% |
| #54 | Cameco, 2003 | Global stock | +856% |
| #53 | Kweichow Moutai, 2016 | Global stock | +897% |
| #52 | Tesla, 2019 | US stock | +149% |
| #51 | Palantir, 2024 | US stock | +360% |
| #50 | Amazon.com, 2015 | US stock | +825% |
| #49 | Nokia, 1998 | Global stock | +862% |
| #48 | Netflix, 2009 | US stock | +645% |
| #47 | Zoom Video, 2020 | US stock | +449% |
| #46 | Google, 2004 | US stock | +558% |
| #45 | Microsoft, 1986 | US stock | +346% |
| #44 | MicroStrategy, 2020 | US stock | +645% |
| #43 | Facebook (Meta), 2013 | US stock | +754% |
| #42 | Amgen, 1990 | US stock | +679% |
| #41 | Infosys (ADR), 1999 | Global stock | +1,342% |
| #40 | Cocoa futures, 2023 | Commodity | +220% |
| #39 | JDS Uniphase, 1998 | US stock | +1,770% |
| #38 | S&P 500 index, 1954 | Index | +243% |
| #37 | BNB, 2021 | Crypto | +1,646% |
| #36 | Gold futures, 2024 | Commodity | +160% |
| #35 | NVIDIA, 2016 | US stock | +638% |
| #34 | Nikkei 225, 1982 | Index | +386% |
| #33 | Research In Motion (BlackBerry), 2003 | Global stock | +2,908% |
| #32 | Bitcoin, 2020 | Crypto | +242% |
| #31 | Tesla, 2013 | US stock | +628% |
| #30 | NVIDIA, 2023 | US stock | +587% |
| #29 | Gold futures, 2005 | Commodity | +319% |
| #28 | Silver futures, 2025 | Commodity | +145% |
| #27 | Nasdaq Composite, 1995 | Index | +538% |
| #26 | eBay, 1998 | US stock | +1,194% |
| #25 | Microsoft, 2016 | US stock | +826% |
| #24 | First Solar, 2007 | US stock | +957% |
| #23 | Tesla, 2020 | US stock | +542% |
| #22 | Gold (London fix), 1978 | Commodity | +330% |
| #21 | Advanced Micro Devices, 2016 | US stock | +3,326% |
| #20 | Coca-Cola, 1985 | US stock | +2,746% |
| #19 | Home Depot, 1982 | US stock | +1,034% |
| #18 | Super Micro Computer, 2023 | US stock | +931% |
| #17 | Dogecoin, 2021 | Crypto | +3,829% |
| #16 | Solana, 2021 | Crypto | +5,159% |
| #15 | Moderna, 2020 | US stock | +1,570% |
| #14 | Walmart, 1977 | US stock | +7,740% |
| #13 | Bitcoin, 2013 | Crypto | +3,508% |
| #12 | Shopify, 2016 | Global stock | +4,084% |
| #11 | Tencent, 2005 | Global stock | +58,208% |
Get the full course
- 100 lessons, counted down from #100 to #1
- 100 narrated videos with the back story and a chart walkthrough
- 100 annotated charts: base, pivot, breakout day, peak and Buy/Sell Line
- 300 checklist points to spot the next big breakout
- Stocks, crypto, commodities, indexes, currencies and bonds
- Watch on desktop, tablet or phone
Not sure yet? Get 5 lessons free first.
EXCHANGE
30-Day Product Exchange Guarantee
We stand behind our trading education. Within 30 days of purchase, you can make a one-time exchange of this course for any other Pro Trader Strategies product of equal or lesser value. See the return policy.
Questions
How do I get access?
Right after checkout you’ll get an email with your access link. The course lives in your Pro Trader Strategies members area.
Is this a subscription?
No. It’s one payment of $99.
How long are the lessons?
Each video runs about one to two minutes, and each written lesson takes about three minutes to read. Go at your own pace.
What is the Buy/Sell Line?
It’s the 50-day or 50-week moving average we use to judge the trend. Every chart in the course shows it, and every lesson explains how price behaved around it.
Do the videos work on my phone?
Yes. Lessons and videos work on desktop, tablet and phone.
Can I try it first?
Yes. Get 5 free lessons (ranked #13 to #30) with just your email address. The top 10 stay locked for course members.
Is this investment advice?
No. The course is educational. It studies historical breakouts and doesn’t recommend buying or selling anything.
Learn from the 100 greatest breakouts in history
100 stories, 100 charts, 100 videos and 300 checklist points. One payment of $99.
Not ready yet?
Get 5 free breakout stories
Five lessons from The Top 100 Breakouts of All Time, sent to your inbox. Free.
Unsubscribe anytime. Educational content only.